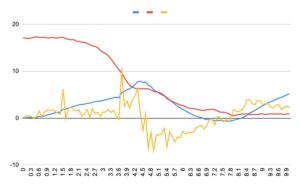
A Science Teacher Rigged a Roller Coaster with Sensors ~Big Thunder Mountain Edition~
I’m Ken Kuwako, your Science Trainer. Every day is an experiment.
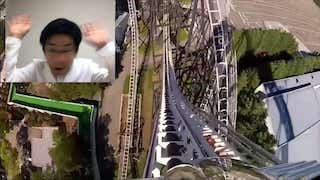
I took a sensor with me on two roller coasters at Tokyo Disneyland—Big Thunder Mountain and Splash Mountain. And I discovered all sorts of things that you’ll never find in a guidebook.
In my previous post, I analyzed the data I collected on Splash Mountain. This time, I’m taking a closer look at the data from Big Thunder Mountain. If you’d like to see the results from Splash Mountain, or learn more about why I decided to do this experiment in the first place, check out this article.
Many of you probably already know what Big Thunder Mountain looks like. This video was filmed by someone else, but if you’ve never ridden it before, take a look!
What the Data Reveals About the Ride’s “True Nature”
So, I actually got on Big Thunder Mountain with a sensor in hand—even though I’m not a fan of roller coasters. To be perfectly honest, it was terrifying. I really don’t want to ride it again. (Unfortunately, I had to ride it twice just to collect the data.)
The thing about thrill rides is that they aren’t scary simply because they’re fast. What makes them frightening is the way the acceleration acting on your body changes from moment to moment, creating unexpected jolts and movements. Our sense of balance is extremely sensitive to these sudden changes. You can find the acceleration and altitude data here.
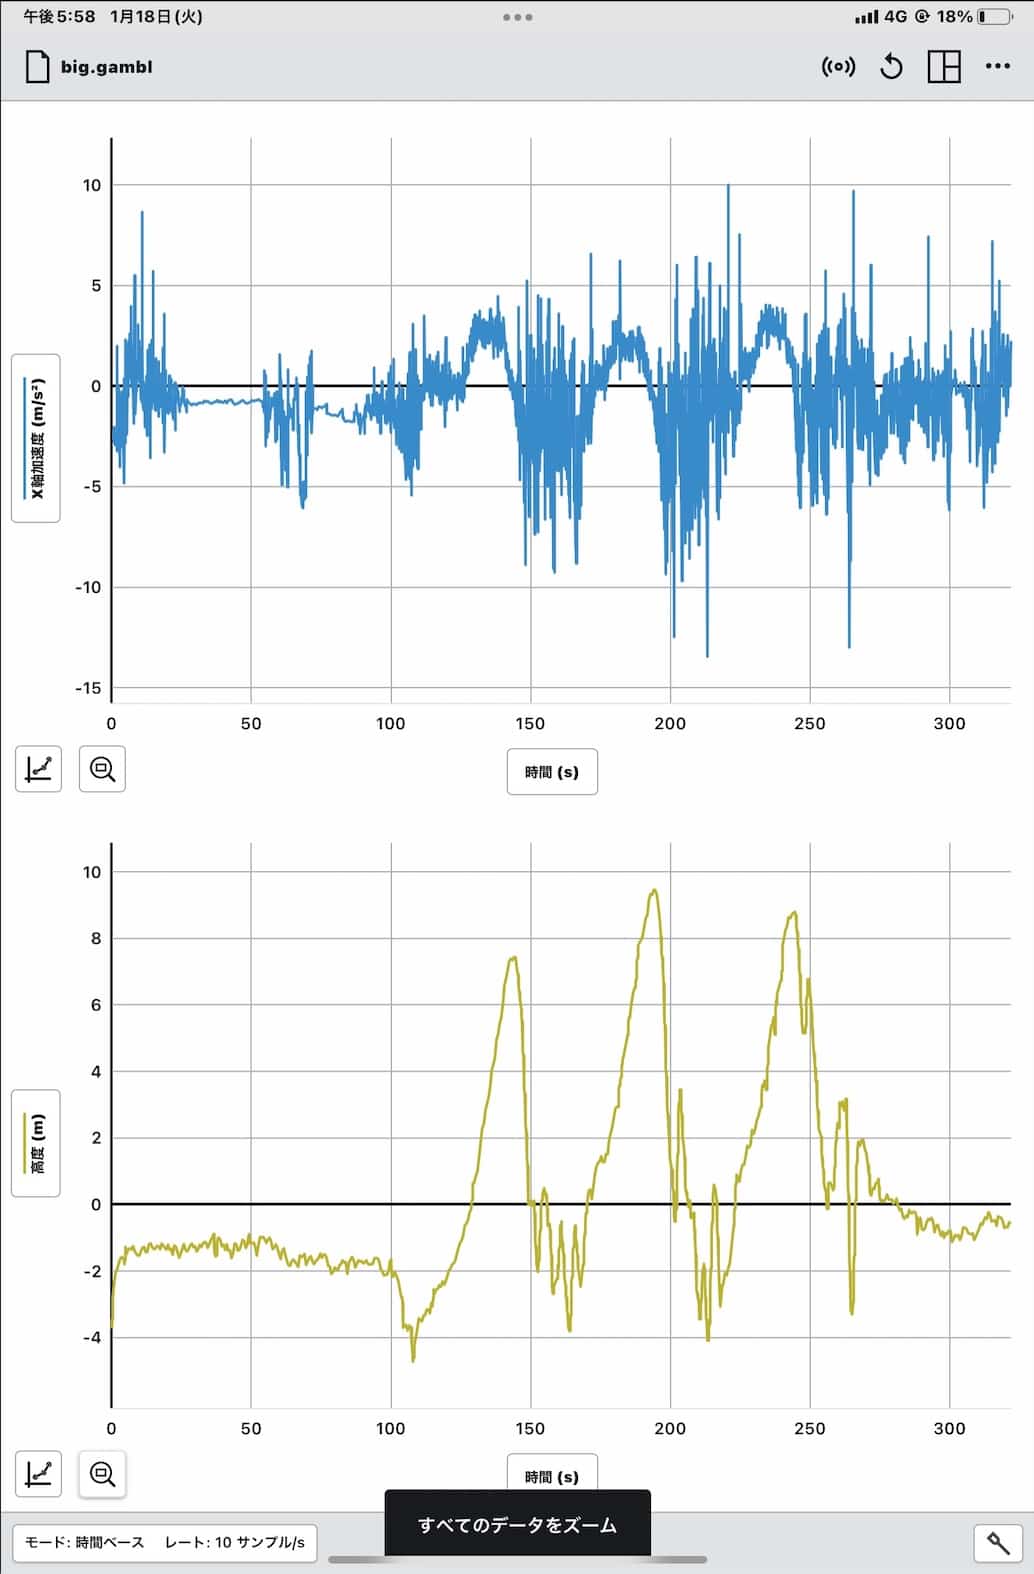
The data showed that Big Thunder Mountain has a maximum vertical drop of about 9.9 m (9.6 m on the first run, and 9.9 m and 9.0 m on the second). The highest point is about 9.5 m above the loading area.
The ride itself lasts about three minutes, which is shorter than Splash Mountain. What I found particularly interesting is that the ride makes three separate “energy top-ups”, converting potential energy into kinetic energy as it goes.
In other words, the coaster isn’t designed to climb one huge hill and then make one enormous drop. Instead, it repeatedly climbs and descends a series of smaller hills. That’s because the coaster’s motor isn’t running continuously. The energy initially supplied by the chain lift is effectively reused as the coaster races through the course.
The Maximum Speed You Won’t Find in the Official Specs
Using the law of conservation of mechanical energy (※), I calculated the maximum speed. The result was 13.9 m/s, which works out to about 47.5 km/h.
This is probably not a figure you’ll find in the official specifications, but it’s still pretty fast! It may come as a surprise that a speed approaching the legal speed limit for cars on city streets is reached on such a relatively compact track.
The data also shows some remarkably intense acceleration and deceleration. This is probably caused by the many small rises and dips along the track.
All of this means that your body is being shaken around quite vigorously, and that seems to be one of the major differences between Big Thunder Mountain and Splash Mountain.
Splash Mountain creates its thrills with one big drop, while Big Thunder Mountain seems to create its thrills through a continuous series of smaller jolts and rapid changes. The data gives us a fascinating glimpse into how differently the two rides are designed, despite both being thrill rides.
It’s quite interesting to see that the underlying design philosophy can be so different.
I’m also making the original data from both Splash Mountain and Big Thunder Mountain available here. If you’d like to analyze the data yourself, feel free to give it a try.
Data exported to a spreadsheet
Original altitude and acceleration data for Splash Mountain
Original altitude and acceleration data for Big Thunder Mountain
Analyzed data
Analyzed altitude and acceleration data for Big Thunder Mountain
Analyzed altitude and acceleration data for Splash Mountain
※ For details on how to calculate speed from the height of a drop, see this article.
Use these data to calculate the speeds of Mount Fuji and Splash Mountain.
Contact & Requests
Want to bring the wonders and excitement of science a little closer to everyday life? I share fun science experiments you can do at home, along with easy-to-understand tips and explanations. Take a look around and see what you can discover!
・The content from Science Notebook is now available as a book. For details, click here
・For more information about Ken Kuwako, the site operator, click here
・For inquiries and requests, including writing, lectures, science workshops, TV science supervision, and appearances, click here
・For updates and new articles, follow me on X!
 Science Notebook Channel features videos of science experiments!
NEW 分解問題集 理科
- 7月21日発売!『高校入試 分解問題集 理科』(学研)…難しい問題も小さな問題に分解することで、問題を解くことができます。そんな分解の技術が身につくように深く関わりを持って作りました。
7・8月のイチオシ実験!
夏でプシュッと爽やか実験!
テレビ番組監修・イベント等のお知らせ
- 7月30日(水)科学監修「TIF presents ONE SONG FES」(フジテレビ) 26:15~27:15
- 12月26日(土) ナリカサイエンスアカデミー(教員向け実験講習会)開催
書籍のお知らせ
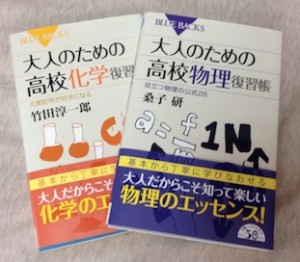
- 『大人のための高校物理復習帳』(講談社)…一般向けに日常の物理について公式を元に紐解きました。特設サイトでは実験を多数紹介しています。※増刷がかかり6刷となりました(2026/02/01)
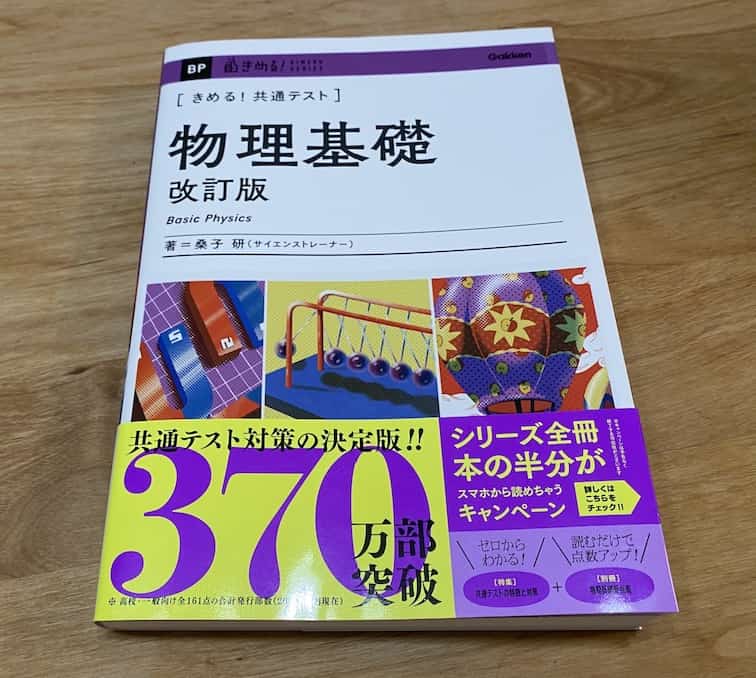
- 『きめる!共通テスト 物理基礎 改訂版』(学研)… 高校物理の参考書です。イラストを多くしてイメージが持てるように描きました。授業についていけない、物理が苦手、そんな生徒におすすめです。特設サイトはこちら。
各種SNS(更新情報をお届け!)
【日本語】X(Twitter)/instagram/Facebook 【英語】BlueSky/Threads
Explore
- 楽しい実験…お子さんと一緒に夢中になれるイチオシの科学実験を多数紹介しています。また、高校物理の理解を深めるための動画教材も用意しました。
- 理科の教材… 理科教師をバックアップ!授業の質を高め、準備を効率化するための選りすぐりの教材を紹介しています。
- Youtube…科学実験等の動画を配信しています。
- 科学ラジオ …科学トピックをほぼ毎日配信中!AI技術を駆使して作成した「耳で楽しむ科学」をお届けします。
- 講演 …全国各地で実験講習会・サイエンスショー等を行っています。
- About …「科学のネタ帳」のコンセプトや、運営者である桑子研のプロフィール・想いをまとめています。
- お問い合わせ …実験教室のご依頼、執筆・講演の相談、科学監修等はこちらのフォームからお寄せください。