Bring Textbook Diagrams to Life! A 3D Google Earth Lesson to Visualize Earthquake Depths
Hi, I’m Ken Kuwako, Science Trainer. Every day is an experiment.
“Teacher, why does Japan have so many earthquakes?”
When covering changes in the Earth’s crust in a science class, have you ever been asked such a simple yet profound question by a student? When we hear about an earthquake on the news—”the epicenter was X kilometers deep”—it’s hard to visualize the dynamic movements happening beneath our feet using just numbers and flat maps.
But what if you could view the epicenters of past earthquakes around the globe as if you were looking through the Earth from space, in 3D, vividly color-coded by depth? Students’ eyes would light up, and textbook content would instantly transform into the fascinating reality of the planet we live on.
Today, I’m introducing a powerful technique that makes this experience possible: combining Google Earth with earthquake data from the USGS (U.S. Geological Survey). The process is surprisingly simple and allows us to “see” the invisible activity deep within the Earth. Give this a try in your next class or at home with your family!
See the Earth’s Pulse: Google Earth Setup Guide
Here is how to map earthquakes that have occurred worldwide onto Google Earth. We will use the website of the USGS (U.S. Geological Survey), which covers global earthquake data. Don’t worry about the English site; the procedure is straightforward.
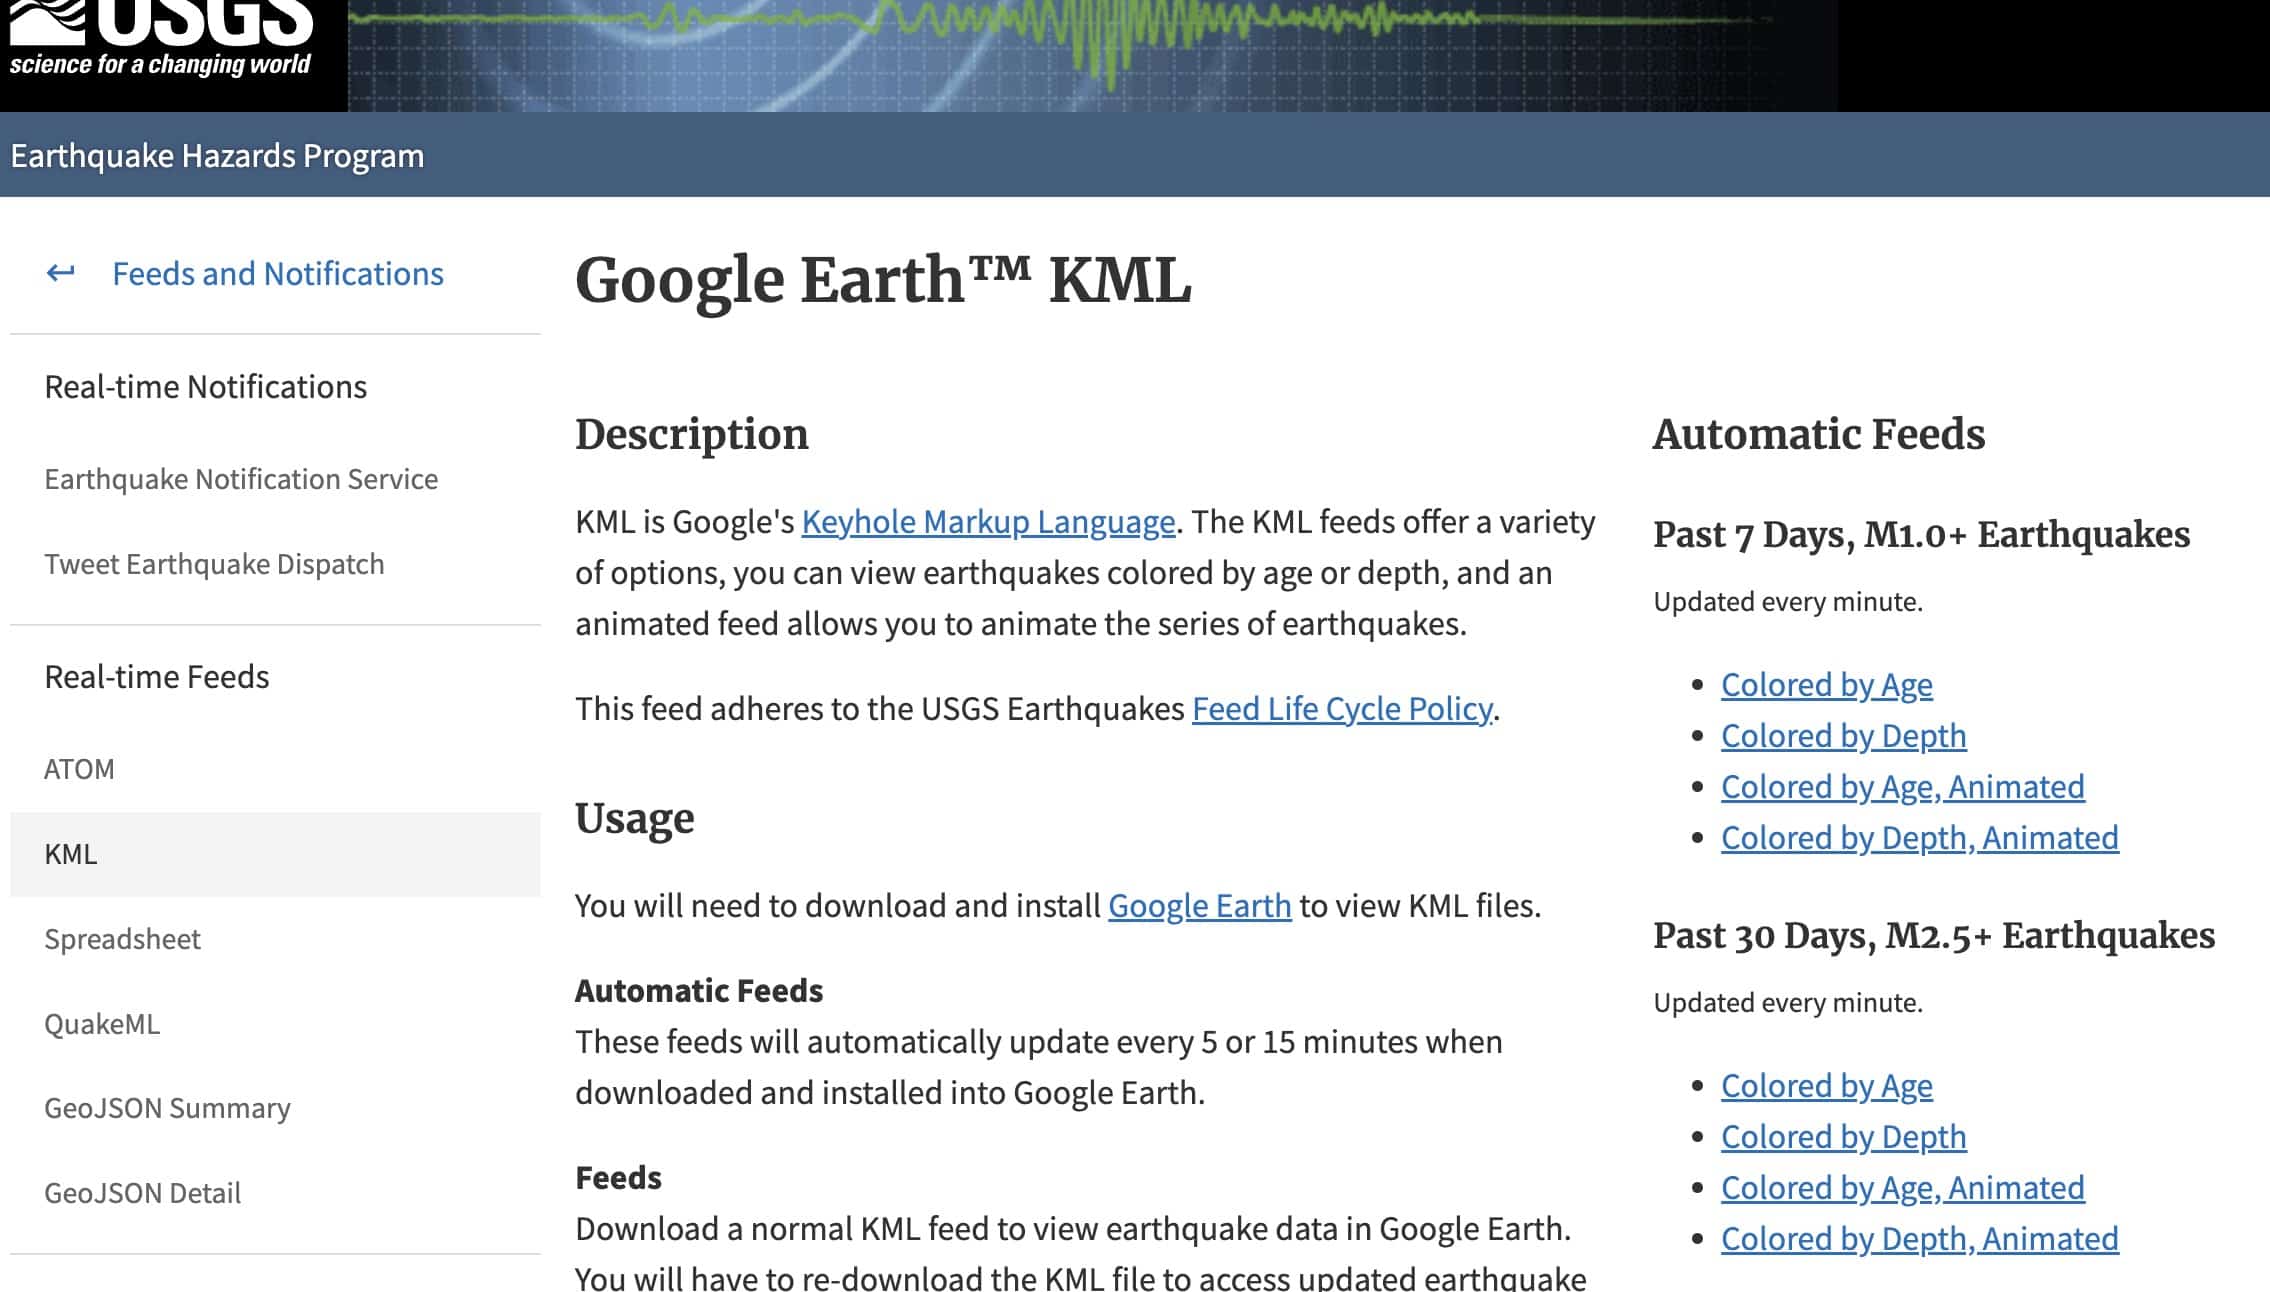
First, navigate to the USGS data distribution page here:
https://earthquake.usgs.gov/earthquakes/feed/v1.0/kml.php
Look for the option “Colored by Depth” in the menu on the right side of the screen. This is where you download the KML file (the data format Google Earth uses). For this example, let’s select “Past 30 Days, M2.5+ Earthquakes.”
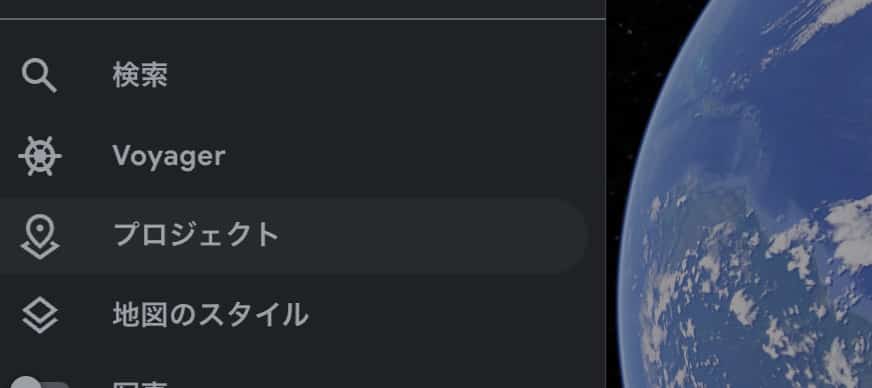
Once the file is downloaded, open Google Earth. The browser version is perfectly fine; no app installation is necessary. Once the Earth appears, click the three-line menu icon in the upper left corner and select “Projects.”
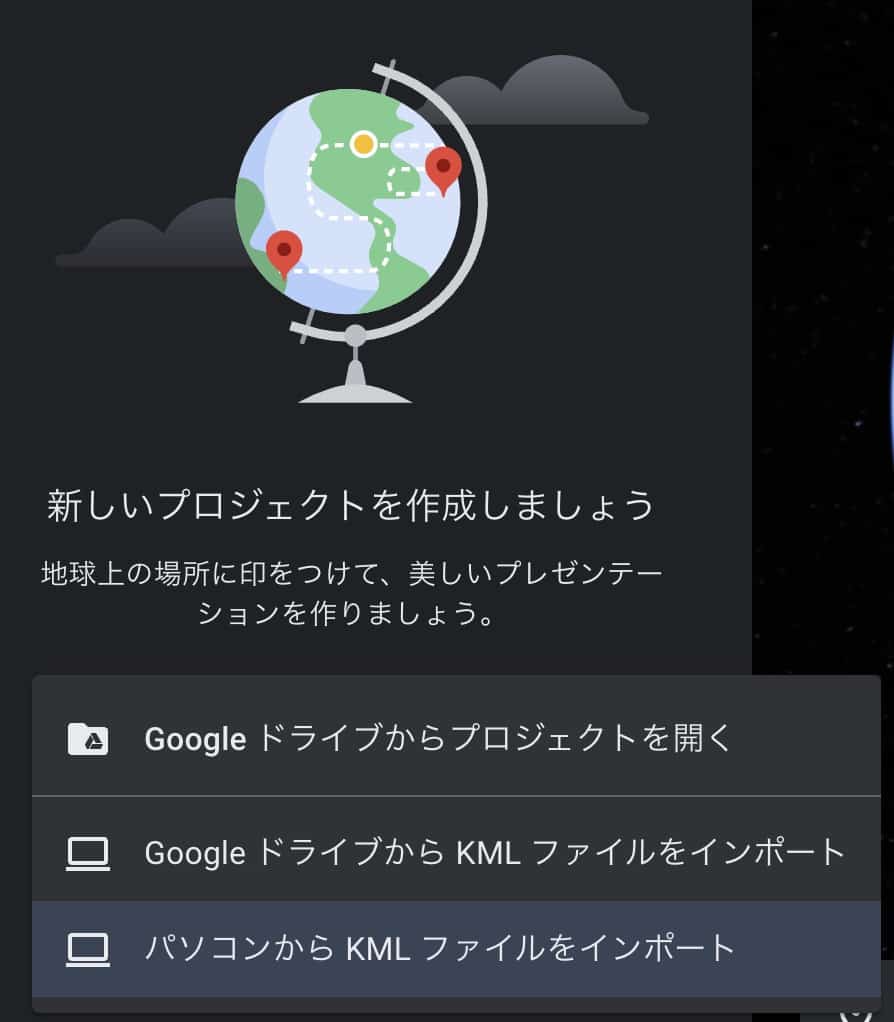
Click the “Open” button, choose “Import KML file from your computer,” and select the file you just downloaded.
What happens next is amazing! Countless dots will suddenly float onto the beautiful blue Earth. These dots mark the locations where our planet has “shaken” recently.
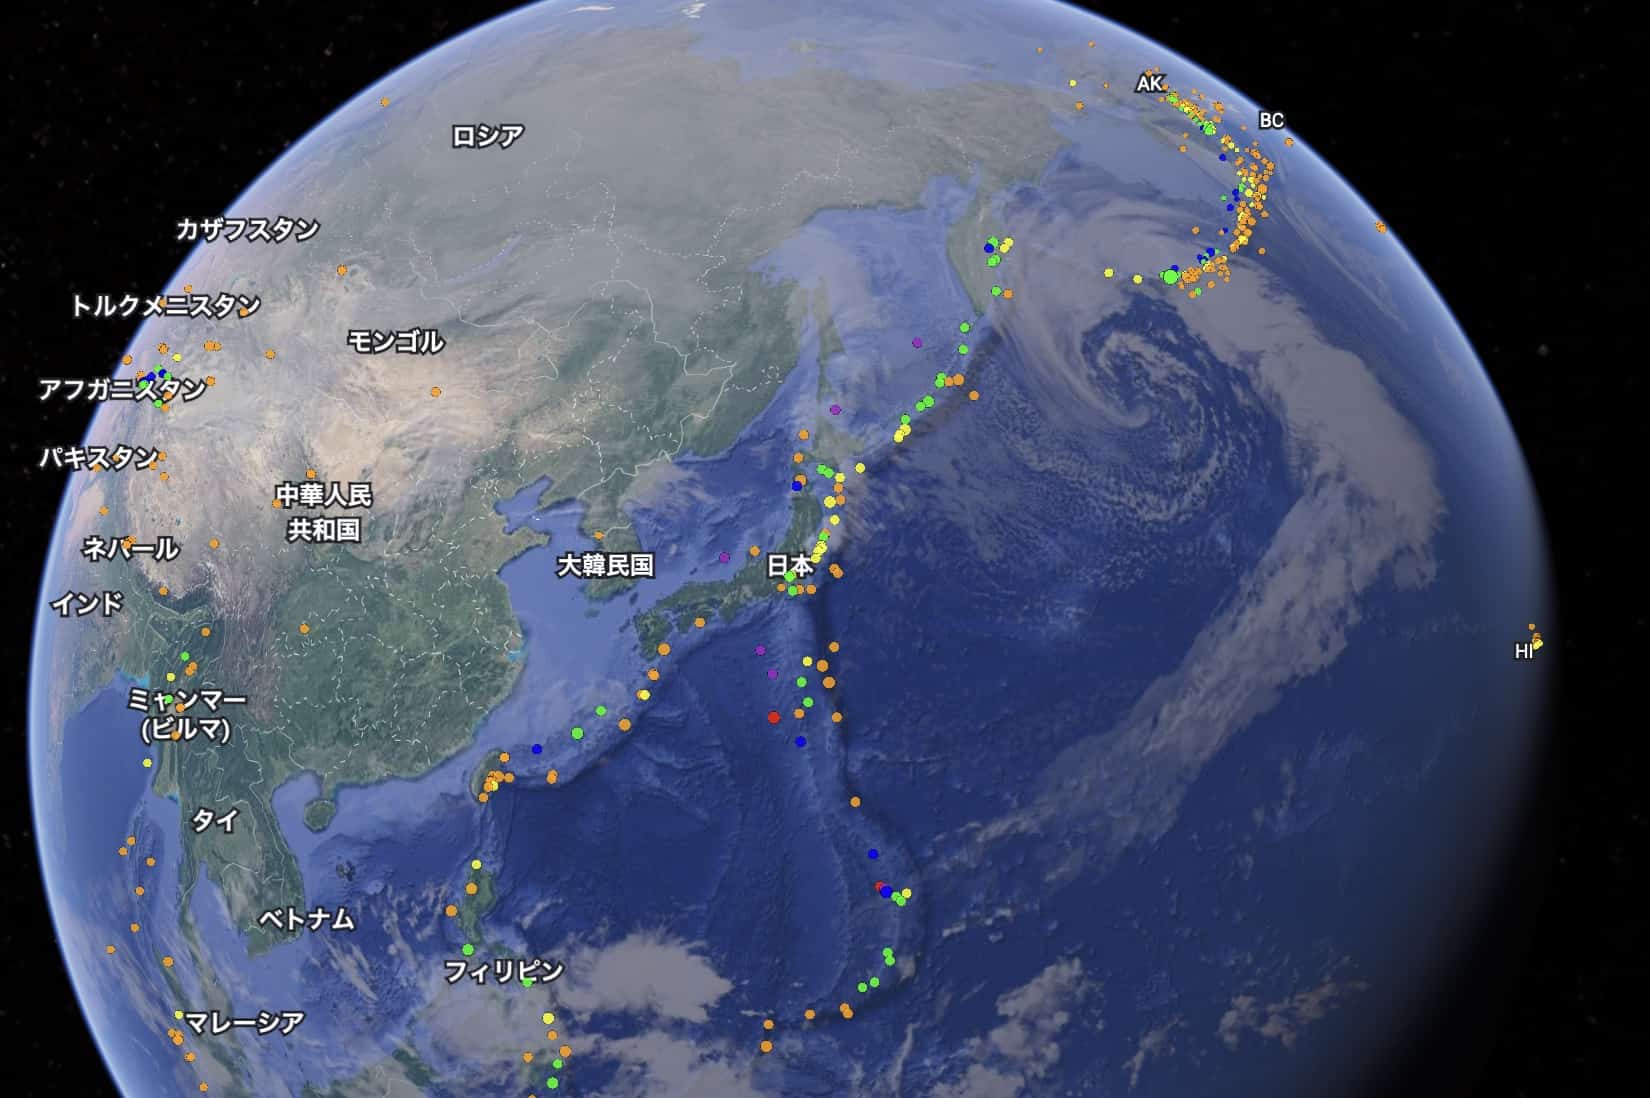
More Than a Map! What “Depth” Reveals About Earth’s Secrets
The best part of this data is that the dots are color-coded by the depth of the epicenter (“Colored by Depth”). Generally, orange and red indicate shallow quakes, while purple and blue signify deeper ones. Here are the key scientific takeaways for leveraging this data in learning:
1. Visualize the “Seismic Hotspots”
If you zoom out, it becomes clear that earthquakes aren’t random; they cluster in specific belts. The famous “Ring of Fire” will stand out vividly. Asking “Why are there so many earthquakes here?” naturally leads into a discussion of plate tectonics.
2. Feel the Subduction of Plates (Wadati-Benioff Zone)
This is the true highlight! Zoom in on the area around the Japanese archipelago. You will see shallow quakes (red/orange) near the Japan Trench (ocean side), and as you move across the island toward the continent, the epicenters become progressively deeper (blue/green). This stunning visualization is proof that the oceanic plate is subducting (sliding) under the continental plate. The “subduction zone” or “Wadati-Benioff zone” you see in textbook cross-sections appears before your eyes as real-world data! Students often exclaim, “Wow, it really is sinking!”
3. Turn Science into Personal Awareness
By reviewing the earthquake distribution around your home region, you gain an objective understanding of the seismic activity in your area. This visual impact is crucial for developing a responsible awareness of disaster prevention, shifting the topic from abstract theory to personal reality.
Instead of just looking at flat maps, this allows you to virtually “touch” the Earth by spinning and manipulating the globe. This interactive learning experience is key to sparking curiosity and deepening scientific understanding. Please incorporate this into your lessons, and join your students in unraveling the mysteries of our dynamic planet!
You can also check out this video for a demonstration of the actual steps:
Contact and Commission Requests
Let’s bring the wonder and fun of science closer to home! We put together easy-to-understand tips and ideas for fun science experiments you can do at home. Feel free to search around!
About the operator, Ken Kuwako: Click here
For various requests (writing, lectures, experiment classes, TV supervision, appearances, etc.): Click here
Article updates are delivered on X!
![]() The Science Content Channel is streaming experiment videos!
The Science Content Channel is streaming experiment videos!
6月のイチオシ実験!
レモンやオレンジで風船を割ろう!インパクトが抜群のリモネン風船の実験
テレビ番組監修・イベント等のお知らせ
- 6月3日(水)20:30〜 「
バカリズムのちょっとバカりハカってみた!」(テレビ東京)を科学監修・出演します。テーマは「 そばの出前は何人前まで運べるのか、限界を測ってみた」です。 - 6月4日(木) 7:00〜 「THE突破ファイル」(日本テレビ)について科学監修しました。
- 6月14日(日) 千葉大学インスタレーション「探究」にて講師を務めます
- 6月26日(金) 公開研究会「脱作業化!デジタル化と段階的指導で実現する オームの法則の探究」
- 6月28日(日) ダビンチマスターズ@昭和女子
- 7月18日(土) 教員向け実験講習会「ナリカカサイエンスアカデミー」の講師をします。お会いしましょう。
書籍のお知らせ
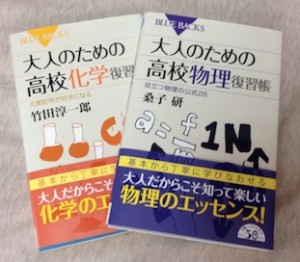
- 『大人のための高校物理復習帳』(講談社)…一般向けに日常の物理について公式を元に紐解きました。特設サイトでは実験を多数紹介しています。※増刷がかかり6刷となりました(2026/02/01)
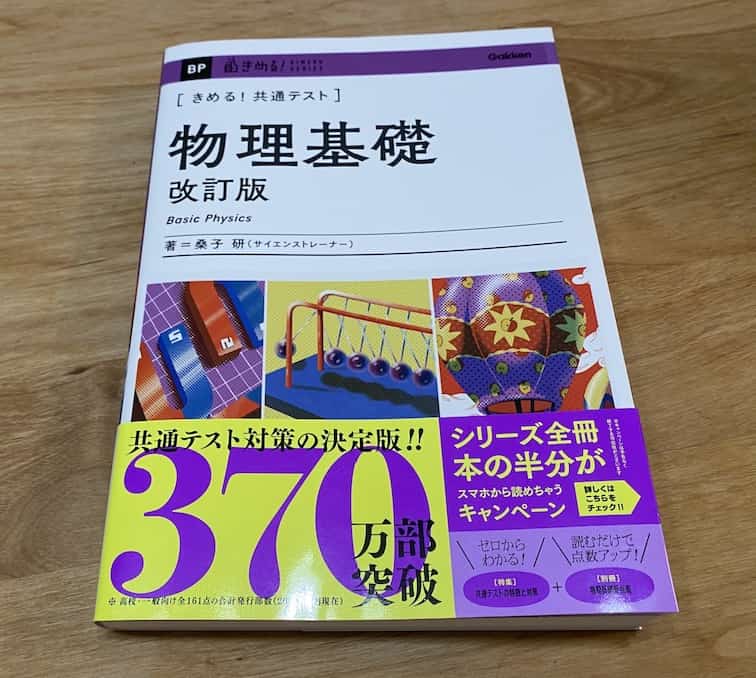
- 『きめる!共通テスト 物理基礎 改訂版』(学研)… 高校物理の参考書です。イラストを多くしてイメージが持てるように描きました。授業についていけない、物理が苦手、そんな生徒におすすめです。特設サイトはこちら。
各種SNS(更新情報をお届け!)
X(Twitter)/instagram/Facebook(日本語)
Explore
- 楽しい実験…お子さんと一緒に夢中になれるイチオシの科学実験を多数紹介しています。また、高校物理の理解を深めるための動画教材も用意しました。
- 理科の教材… 理科教師をバックアップ!授業の質を高め、準備を効率化するための選りすぐりの教材を紹介しています。
- Youtube…科学実験等の動画を配信しています。
- 科学ラジオ …科学トピックをほぼ毎日配信中!AI技術を駆使して作成した「耳で楽しむ科学」をお届けします。
- 講演 …全国各地で実験講習会・サイエンスショー等を行っています。
- About …「科学のネタ帳」のコンセプトや、運営者である桑子研のプロフィール・想いをまとめています。
- お問い合わせ …実験教室のご依頼、執筆・講演の相談、科学監修等はこちらのフォームからお寄せください。