We Measured Every Second of Splash Mountain’s Altitude and Acceleration! ~Disneyland Physics~
I’m Ken Kuwako, your Science Trainer. Every day is an experiment.
The other day, I was scheduled to accompany my students on a school trip to Tokyo Disneyland. I’ve always thought that Disneyland is a treasure trove of teaching materials, so this was the perfect opportunity. Since I was going anyway, I decided to turn the roller coasters into a science lesson and borrowed a GoDirect accelerometer from Narika, an educational science equipment company.
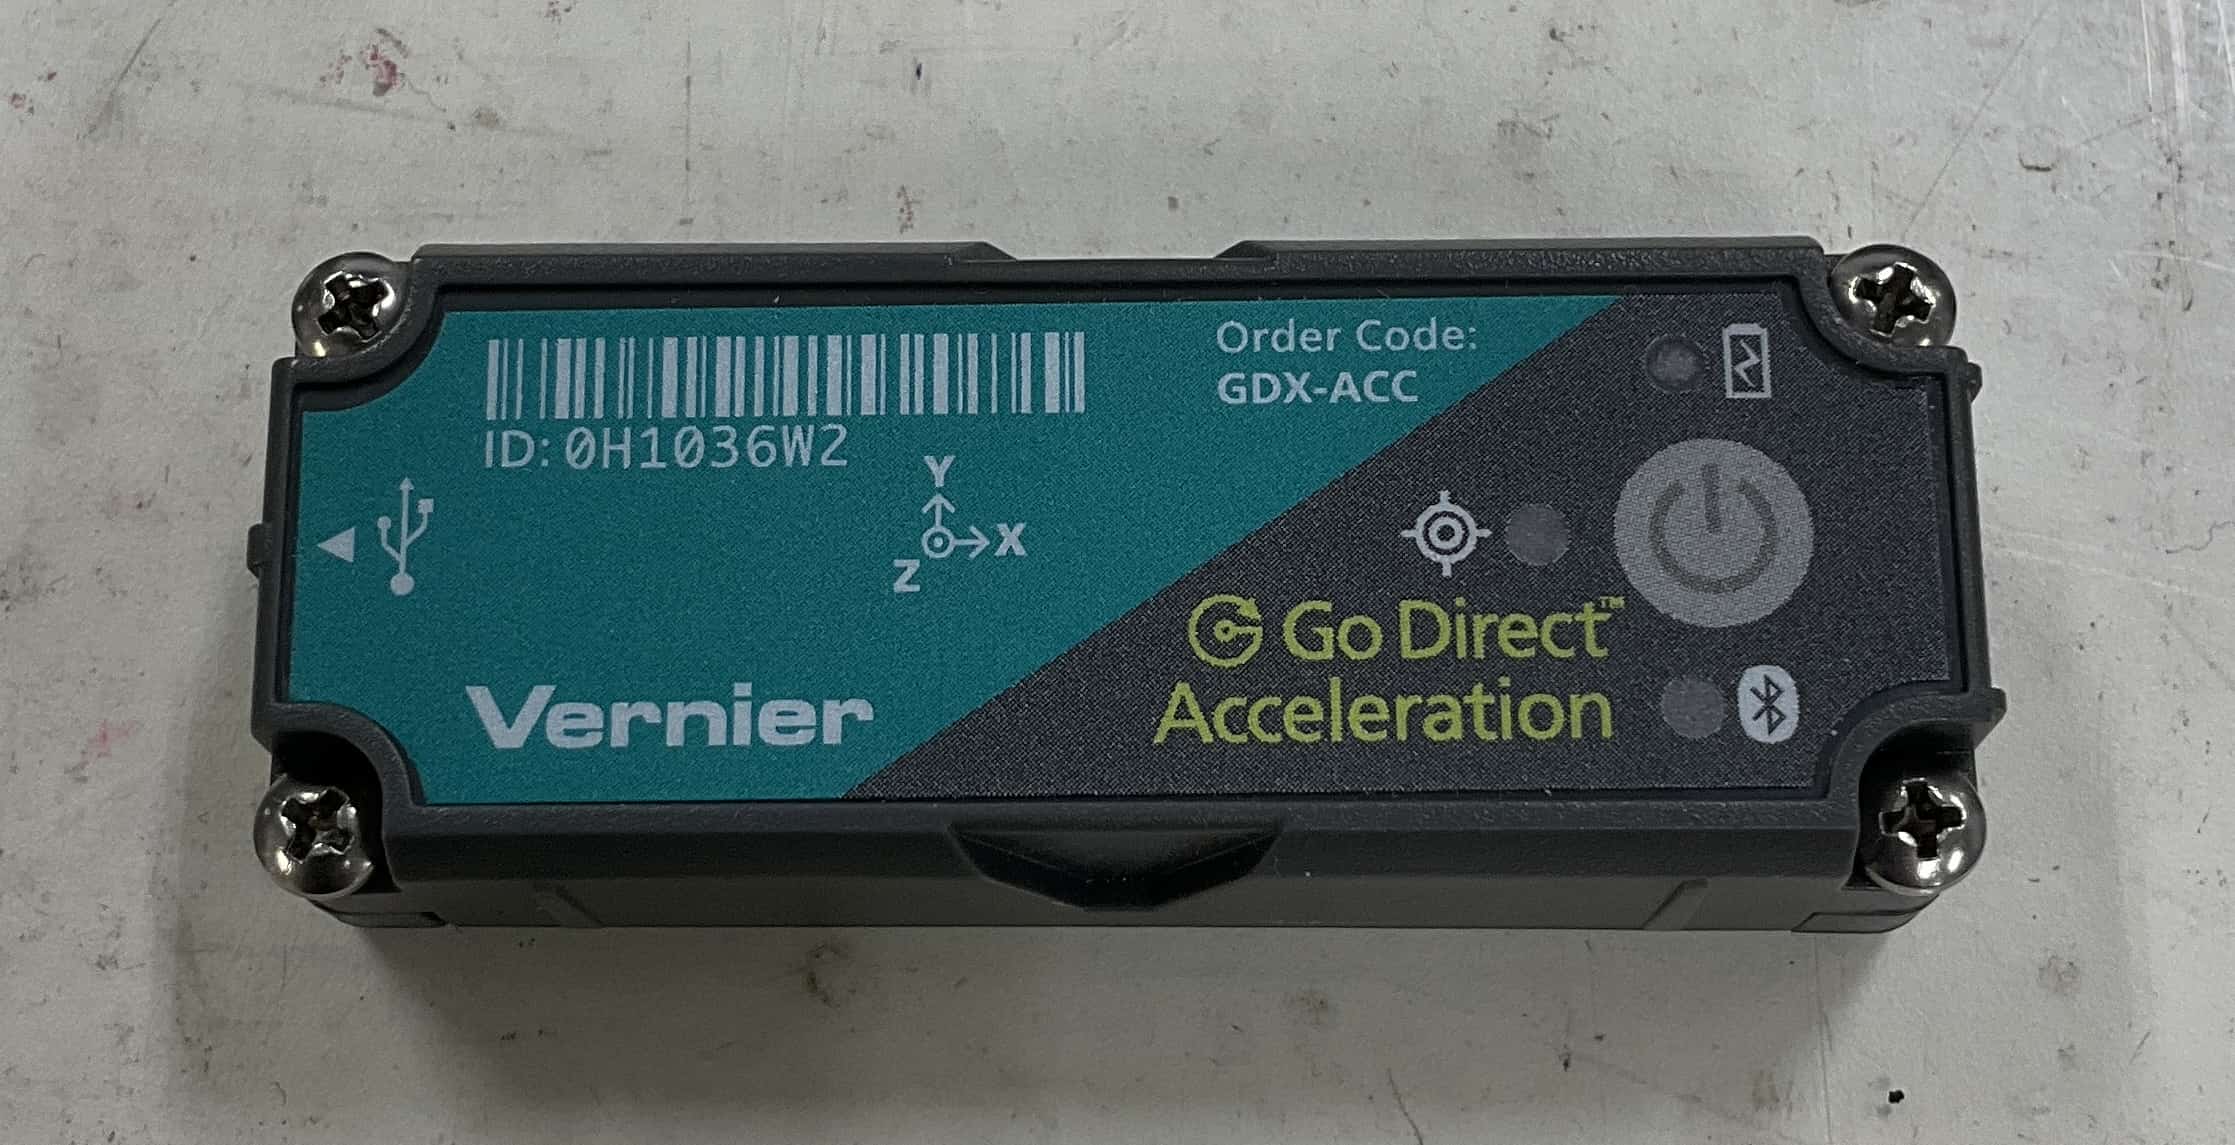
This is the accelerometer. Besides acceleration, it can also measure altitude. It can be connected to an iPad for data collection.
I slipped it into my pocket and collected altitude and acceleration data while riding Splash Mountain, Big Thunder Mountain, and Space Mountain. There was just one small problem: I’m not a fan of roller coasters, and it had been decades since I’d last ridden one. I was scared, so I recruited another teacher to ride with me.
Experiments don’t always work on the first try—that’s practically part of the fun. Unfortunately, my measurements didn’t work out the first time, so we ended up riding each attraction twice. (Sigh.) My colleague kindly went along with me, too. Luckily, because Tokyo Disneyland was operating with reduced capacity due to COVID-19 at the time, we were able to get on each attraction in about 15 minutes. That was a pleasant surprise, especially since I had been prepared to wait two hours!
Let’s start with the Splash Mountain data
Let’s begin with the data from Splash Mountain. The upper graph shows acceleration along the x-axis (the direction of travel), while the lower graph shows altitude.
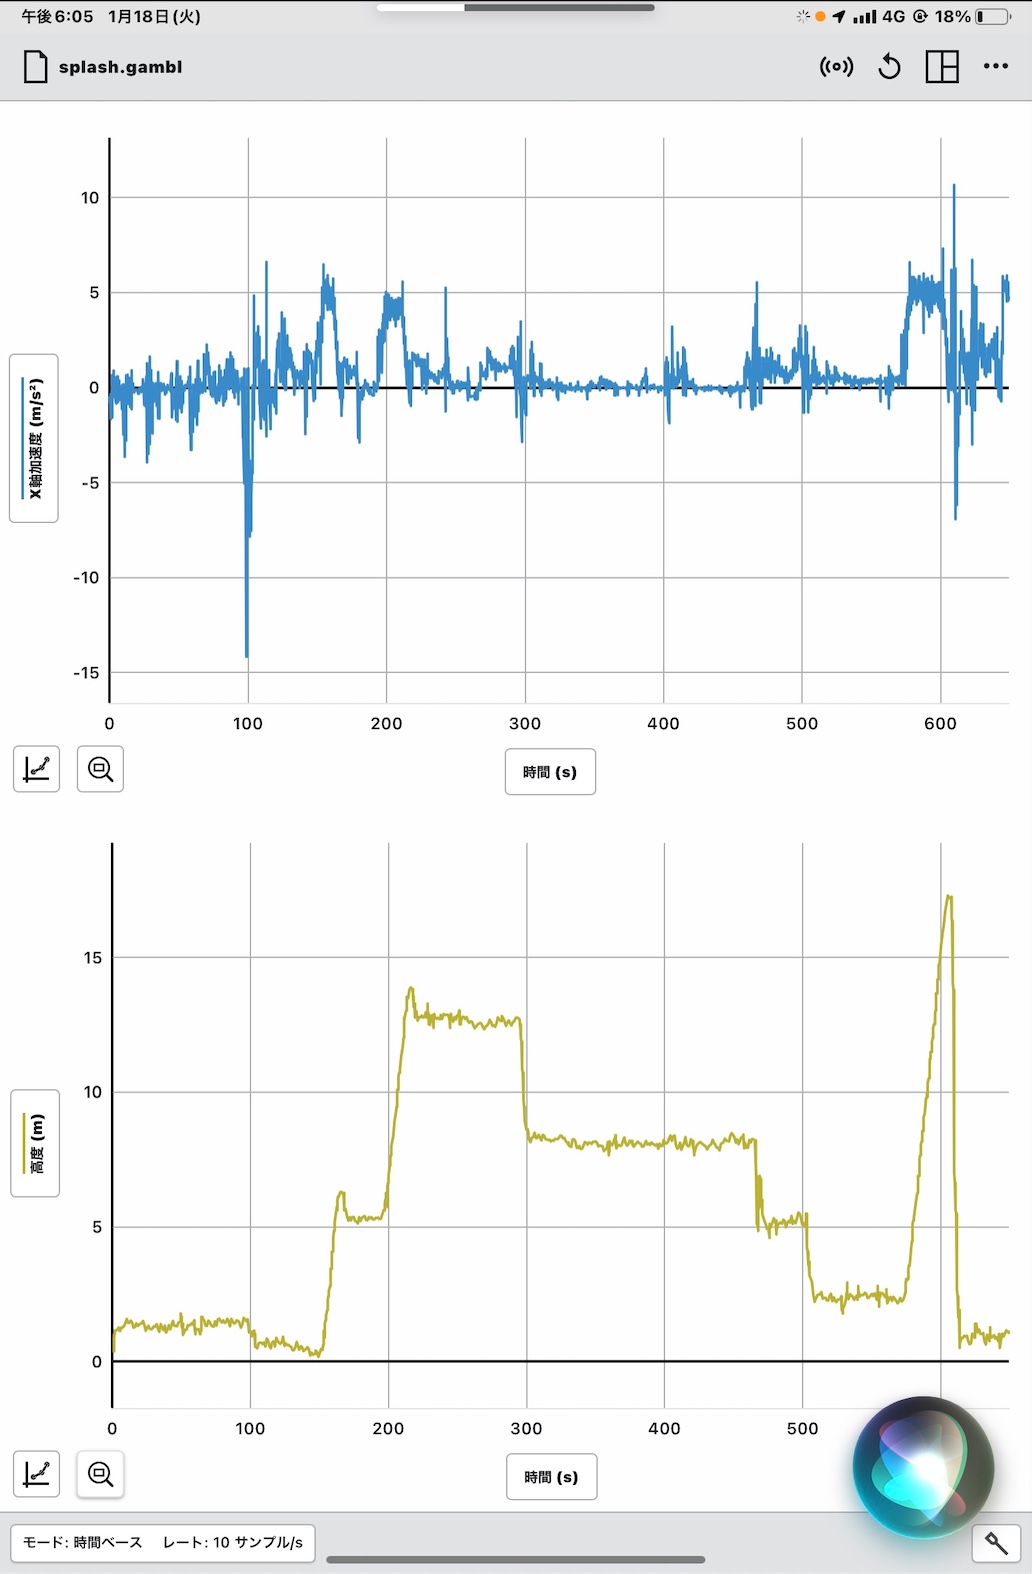
I’ll share the data with you later. Looking at the altitude data as a whole, we can see that Splash Mountain has four drops—and you can definitely feel them while riding. The ride lasts about six minutes, which is remarkably long for a roller coaster. Here’s a video released by someone who actually rode the attraction. It might be fun to watch it while referring to the graph above.
Even this data alone tells us quite a lot. According to the official guidebook, the maximum drop is 16 m, and the actual measurement came out at 16.2 m—almost exactly the same! Looks like the altimeter was doing its job.
The total height above the loading area, rather than the drop height, is 17.1 m. And yes, that is pretty intimidating.
Using only these data and the conservation of mechanical energy, we can calculate the maximum speed. The theoretical value comes out to about 64 km/h (see here for the calculation).
The official website lists the speed as 62 km/h, probably because of factors such as friction. The fact that the theoretical calculation and the official figure came out so close was one of those moments when I couldn’t help saying, “Wow!” while doing the math.
An unexpected pitfall revealed by integrating the acceleration data
I also analyzed the acceleration data during the big finale—the final drop down the waterfall—and calculated the speed by integrating the acceleration. The result is shown in the graph below.
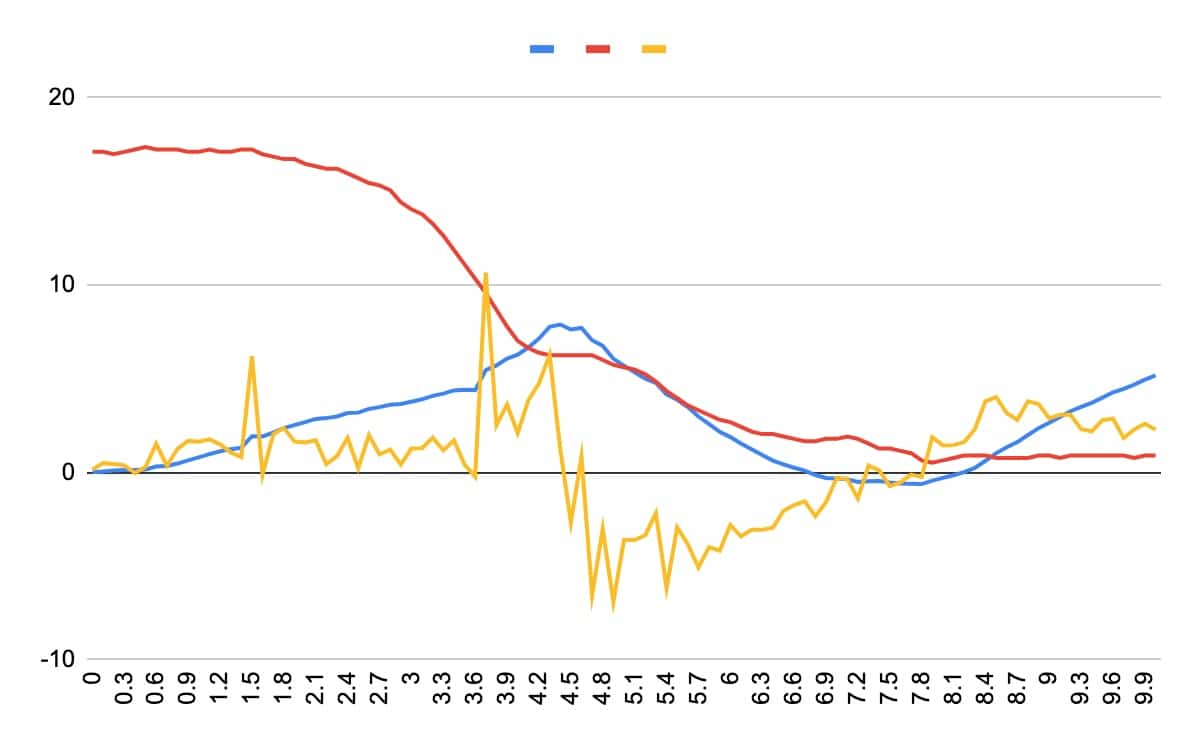
The red line shows altitude [m], the yellow line shows the measured acceleration [m/s2], and the blue line shows the speed [m/s] obtained by integrating the acceleration data.
When I integrated the acceleration data to calculate the speed, the maximum came out to just 8 m/s (28 km/h). But when we calculate the maximum speed from the drop height using conservation of mechanical energy, the theoretical value is about 63 km/h. That’s quite a substantial difference from the actual speed.
The most likely reason is that the sensor only measured acceleration along the x-axis. I really wish I’d measured the acceleration along the y- and z-axes as well and combined all three afterward. (Crying.) I’ll have to try again someday.
In reality, while the ride is falling, the vehicle—and our bodies—experience complicated accelerations not only forward and backward, but also vertically and sideways. This was a perfect hands-on reminder that measuring motion in just one direction doesn’t give you the full picture.
Were we briefly in a “weightless” state!?
One particularly interesting finding was that the sensor recorded an acceleration of 10 m/s² at the point where the altitude was dropping rapidly. When I calculated the vertical acceleration from the altitude data as well, I got a value of around 12 m/s². So, at least when it comes to vertical acceleration, could it possibly have exceeded the acceleration due to gravity (9.8 m/s²)?
In any case, based on the data we have, it looks as though Splash Mountain briefly approaches a state of weightlessness, with riders floating for about 0.1 seconds. Some of you may have experienced that light, floating sensation when an elevator suddenly drops. The same phenomenon is happening during the roller coaster’s descent—only much more intensely.
The data also show that the ride brakes very suddenly, probably because of the water. This is a feature that you don’t see on other roller coasters, and it seems likely that the strong resistance of the water acts as the boat hits the water’s surface.
For an analysis of Big Thunder Mountain, check out this article. We discovered all sorts of facts that you won’t find in a guidebook.
I’m sharing the data—and promising a rematch next time!
I’m also making the original data from both Splash Mountain and Big Thunder Mountain available here.
Data exported to a spreadsheet
Original altitude and acceleration data for Splash Mountain
Original altitude and acceleration data for Big Thunder Mountain
Analyzed data
Analyzed altitude and acceleration data for Big Thunder Mountain
Analyzed altitude and acceleration data for Splash Mountain
For anyone who might be brave enough to take a GoDirect accelerometer onto a roller coaster in the future (is anyone really going to do that!?), here’s some useful information about the settings. I set the sampling rate to record data every 0.1 seconds. The default setting is 0.02 seconds, but I found that recording at such a high rate for a long period can sometimes cause errors.
You also need to set the recording to stop manually. Otherwise, it will automatically stop after one minute. Because of these settings issues, we ended up riding each attraction twice… Since Splash Mountain takes about six minutes, even at a sampling interval of 0.1 seconds, you end up with around 6,000 data points.
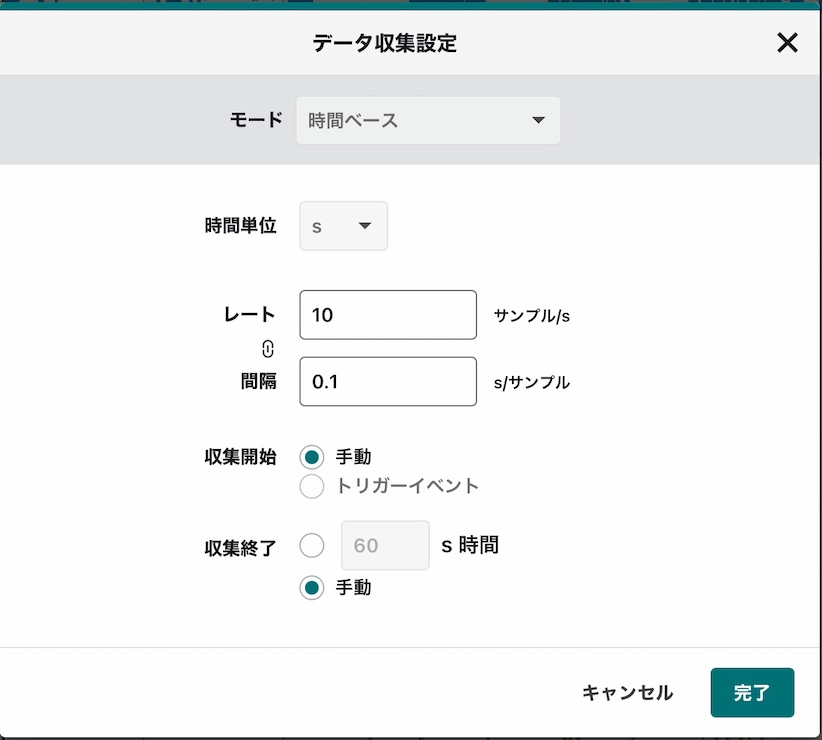
And if I ever get the chance to go again, I’d like to turn on the x-, y-, and z-axis acceleration sensors as well as the altitude sensor.
If we can record all three directions instead of just one, we’ll be able to see the true magnitude and direction of the forces acting on the body. I’m sure we’ll be able to solve some of the mysteries that remained unanswered this time.
I’ve also put together an explanation of how to calculate the theoretical maximum speed. Take a look here.
And why not try calculating the speeds of Splash Mountain and FUJIYAMA yourself?
Contact and inquiries
Bring the wonder and excitement of science a little closer to everyday life! I share fun science experiments you can do at home, along with easy-to-understand tips and explanations. Have a look around and see what you can discover!
・The content from 科学のネタ帳 is now available as a book. For more information, click here
・For more information about Ken Kuwako, the creator of this site, click here
・For inquiries and requests, including writing, lectures, science workshops, TV science supervision, and TV appearances, click here
・Follow X for the latest article updates!
 The 科学のネタ channel features videos of science experiments!
10月のイチオシ実験!
https://youtube.com/shorts/jLVKYRVI1uY?feature=share
テレビ番組監修・イベント等のお知らせ
- 12月26日(土) ナリカサイエンスアカデミー(教員向け実験講習会)開催
書籍のお知らせ
- 『高校入試 分解問題集 理科』(学研)…難しい問題も小さな問題に分解することで、問題を解くことができます。そんな分解の技術が身につくように深く関わりを持って作りました。
 『大人のための高校物理復習帳』(講談社)…一般向けに日常の物理について公式を元に紐解きました。特設サイトでは実験を多数紹介しています。※増刷がかかり6刷となりました(2026/02/01)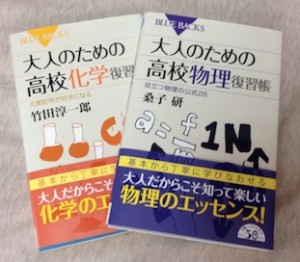
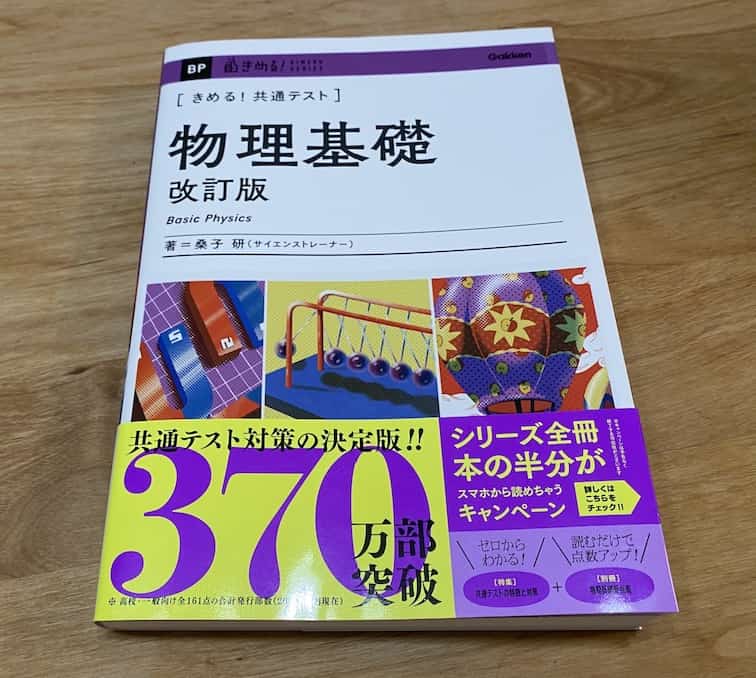
- 『きめる!共通テスト 物理基礎 改訂版』(学研)… 高校物理の参考書です。イラストを多くしてイメージが持てるように描きました。授業についていけない、物理が苦手、そんな生徒におすすめです。特設サイトはこちら。
各種SNS(更新情報をお届け!)
【日本語】X(Twitter)/instagram/Facebook 【英語】BlueSky/Threads
Explore
- 楽しい実験…お子さんと一緒に夢中になれるイチオシの科学実験を多数紹介しています。また、高校物理の理解を深めるための動画教材も用意しました。
- 理科の教材… 理科教師をバックアップ!授業の質を高め、準備を効率化するための選りすぐりの教材を紹介しています。
- Youtube…科学実験等の動画を配信しています。
- 科学ラジオ …科学トピックをほぼ毎日配信中!AI技術を駆使して作成した「耳で楽しむ科学」をお届けします。
- 講演 …全国各地で実験講習会・サイエンスショー等を行っています。
- About …「科学のネタ帳」のコンセプトや、運営者である桑子研のプロフィール・想いをまとめています。
- お問い合わせ …実験教室のご依頼、執筆・講演の相談、科学監修等はこちらのフォームからお寄せください。
- Seeing the World Through an Insect’s Eyes? The Hidden Secrets of Dandelions and Azaleas

- Did the Chopstick Snap? Did It Move Backward? The Strange Images in a Glass of Water
- Making the Invisible Visible: A Laser and Fog Machine Light Show!

- The 1,300-View Wall! What Middle Schoolers Learned About “Reaching People” Through Short Videos (Science Communication Course)

- Is the Image on Your Retina Upside Down? Discover the Magic of Light with a Squid Eye Experiment

- We Built a Volcano—and It Was Explosively Fun! The Ultimate Experiment Recipe Using Plaster and Baking Soda!

- Data So Clean It’ll Wow You! Cracking the Link Between Potential Energy and Work with Just a Rail and a Marble

- Why Are the Top and Bottom of a Leaf Different Colors? The Surprising Link Between Light and Cell Density

- 4x Faster Than Sunlight?! The Secret of Plant Factories Growing Lettuce Under Red Light (Plot Twist: It Was Purple Light!)