Beyond the Beep: Why Modern Science Labs are Ditching the Timer for Real-Time Sensors.
Ken Kuwako, Science Trainer. Every Day is an Experiment.
“Da-da-da-da-da!”
Hearing this sound, many of you might recall the “recording timer” used in your middle school science lab. The experiment where dots are marked on a strip of paper tape. While that experiment is excellent for recording motion, what if the change in speed of a cart rolling down an inclined plane could be graphed in real-time, right at the very moment it’s happening? Doesn’t just imagining that make you a little excited?
Currently, in standard science education worldwide, experiments using sensor-based equipment are becoming the norm. Why go to the trouble of using these sensor devices? For example, when studying the motion of an object, the old-fashioned cart and recording timer/tape experiment should be sufficient, right? To be honest, I didn’t fully understand the real reason why we should use this technology for mechanics.
However, once I actually used it myself, the reason became painfully clear. It possessed the power to change our very understanding of the “experiment” itself. Why use these sensor systems? Today, I want to explain their “amazing power,” using the example of a cart moving down an inclined plane.
The Science Recipe
First, let me introduce the experimental method.
Materials needed:
Dynamics cart, white board, sensor (EasySense), inclined plane
Procedure:
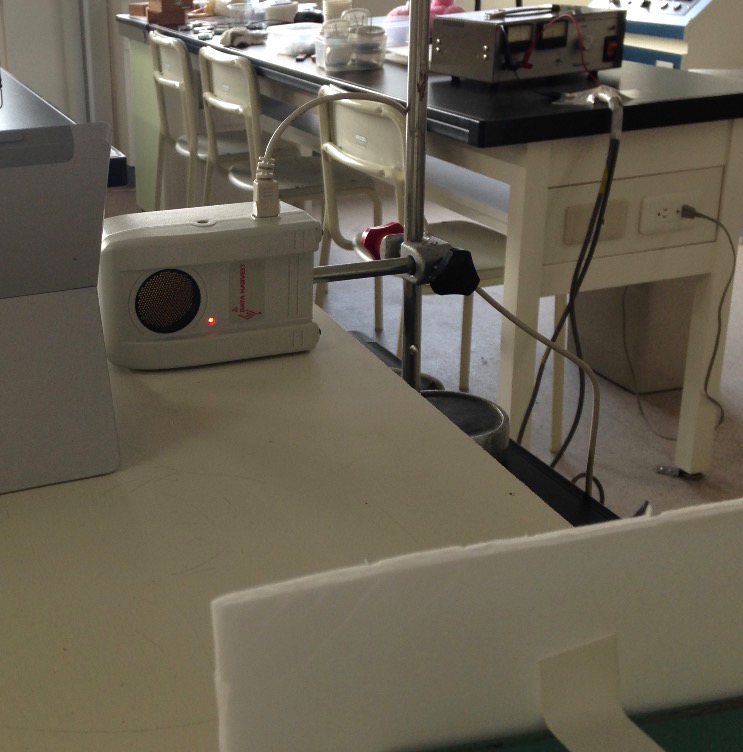
1. Attach the white board to the cart (This makes it easier for the sensor to measure distance).
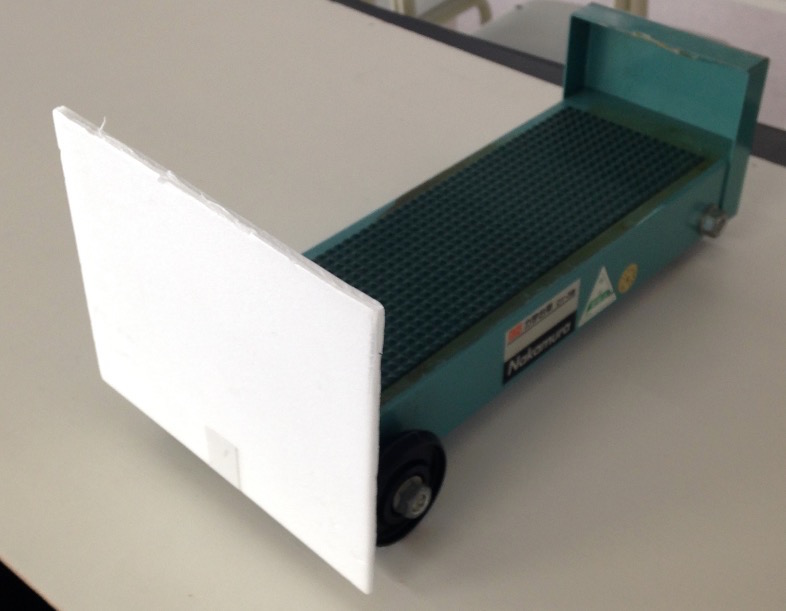
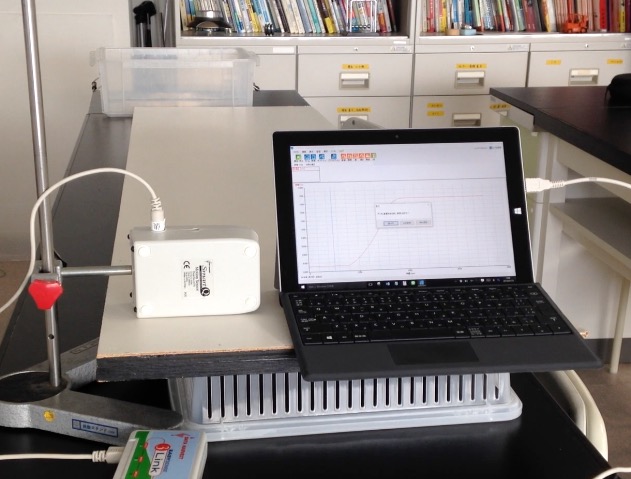
2. Run the cart while using the EasySense (distance sensor) to collect distance data.
3. Measure the angle of the inclined plane.
4. Analyze the data and compare it with the theoretical value of the cart’s acceleration (rate of change of speed).
So, what does the sensor make possible in this simple experiment?
Amazing Power #1: Instant “Visualization”! Motion Directly Translated to a Graph
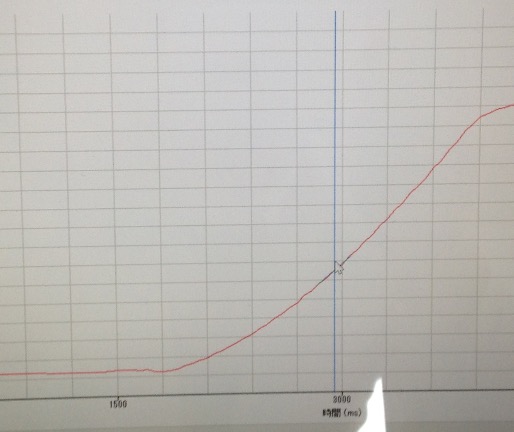
The first great thing about using a sensor system is that the phenomenon happening is converted into data in “real-time.” Seeing is believing. Please take a look at this video:
What do you think? The moment the cart moves, a “distance graph” is drawn on the computer screen. This is similar to how athletes repeatedly check their form on video. Because “how it moved just now” is depicted in real-time in the language of a graph, it becomes incredibly easy to understand what is being measured. It is immediately clear: “Ah, it’s getting faster!” and “It’s fastest here!” This is a piece of equipment every lab should have for whole-class demonstrations.
The settings screen looks like this. You can change the time range as well.
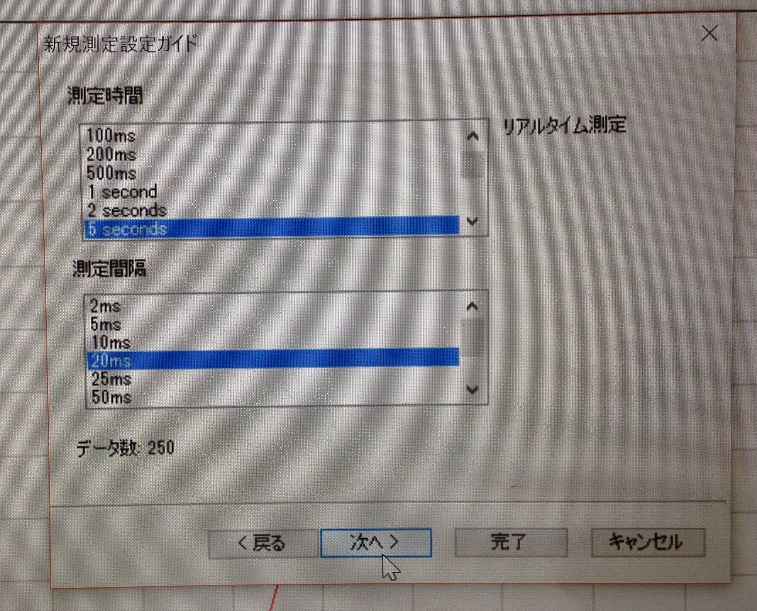
This time, I tried a measurement time of 5 seconds with a measurement interval of 20 milliseconds (50 measurements per second).
Amazing Power #2: “Trial and Error” is Science! Experiments Can Be Repeated Instantly
Recall the experiment using the recording timer and tape. You have to prepare the tape, stick it to the cart, run the experiment, collect the tape, cut it every 5 dots (every 0.1 seconds), and glue it onto graph paper… Trying to get data from every student within a one-hour class becomes a frantic scramble. Inevitably, a lot of time is taken up by the “preparation” and “cleanup” process.
This makes it difficult to change conditions, repeat the experiment, and verify the data, right? But what about using sensor software? The experiment starts and stops with a single click. It can be performed repeatedly, instantly. This allows students to immediately test “what if” scenarios, such as “What happens if we change the angle of the incline?” or “What about a heavier cart?” This is the excitement of scientific inquiry!
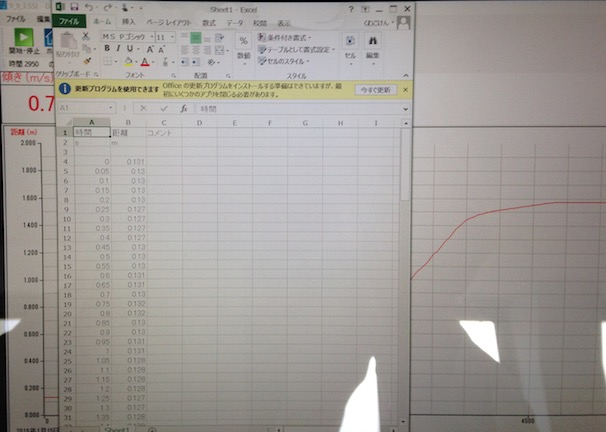
Furthermore, the data can be exported to Excel for analysis.
(Of course, the traditional method of cutting and pasting the recording timer tape has its own wonderful side: the change in speed is easily understood as a tangible “length of tape.” Ideally, doing both might be best.)
Nevertheless, the skill to analyze data using Excel and similar tools is essential for success in society. If you want students to have that authentic experience, sensor-based equipment is indispensable.
Amazing Power #3: Beyond the Senses! Visualizing the “Invisible World”
And I believe this is the true strength of the sensor. The cart’s motion in this experiment was something visible to the naked eye. However, where the sensor truly shines is when it captures things that are not directly visible, such as sound, electricity, temperature, or light, and translates them into data. Take “sound,” for example. The “pitch (frequency)” or “loudness (amplitude)” of sound is invisible to our eyes. But through a sensor (microphone), its true nature as a “waveform” can be displayed on a graph.
The sensor acts as a translator, converting a world that is beyond human perception into the common language of “data” and “visualizing” it right before our eyes. This is the sensor’s greatest innovation. The difficulty, though, is the price. Although this equipment used to be very expensive, a revolutionary device called the “Recording Timer D” has been released. What is this affordable and easy-to-use recording timer? Please check it out here:
Inquiries and Requests
Making the wonder and fun of science more accessible! I’ve put together easy-to-understand explanations of fun science experiments you can do at home and tips for carrying them out. Please search around!
- The content of the Science Idea Notebook is now available as a book. Find out more here
- About the administrator, Ken Kuwako: here
- For various requests (writing, lectures, experiment classes, TV supervision, appearances, etc.): here
- Article updates are posted on X!
![]() 科学のネタチャンネル is distributing experiment videos!
科学のネタチャンネル is distributing experiment videos!
6月のイチオシ実験!
レモンやオレンジで風船を割ろう!インパクトが抜群のリモネン風船の実験
テレビ番組監修・イベント等のお知らせ
- 6月26日(金) 公開研究会「脱作業化!デジタル化と段階的指導で実現する オームの法則の探究」
- 6月28日(日) ダビンチマスターズ@昭和女子
- 6月30日(火) 6/30 23:56〜 【科学監修・出演】「地球まるごと大実験ネイチャーティーチャー」(TBS)
- 7月18日(土) 教員向け実験講習会「ナリカカサイエンスアカデミー」の講師をします。お会いしましょう。
- 12月26日(土) ナリカサイエンスアカデミー(教員向け実験講習会)開催
書籍のお知らせ
- 7月16日発売 『高校入試 分解問題集 理科』(学研)…難しい問題も小さな問題に分解することで、問題を解くことができます。そんな分解の技術が身につくように深く関わりを持って作りました。
- 『大人のための高校物理復習帳』(講談社)…一般向けに日常の物理について公式を元に紐解きました。特設サイトでは実験を多数紹介しています。※増刷がかかり6刷となりました(2026/02/01)
- 『きめる!共通テスト 物理基礎 改訂版』(学研)… 高校物理の参考書です。イラストを多くしてイメージが持てるように描きました。授業についていけない、物理が苦手、そんな生徒におすすめです。特設サイトはこちら。
各種SNS(更新情報をお届け!)
【日本語】X(Twitter)/instagram/Facebook 【英語】BlueSky/Threads
Explore
- 楽しい実験…お子さんと一緒に夢中になれるイチオシの科学実験を多数紹介しています。また、高校物理の理解を深めるための動画教材も用意しました。
- 理科の教材… 理科教師をバックアップ!授業の質を高め、準備を効率化するための選りすぐりの教材を紹介しています。
- Youtube…科学実験等の動画を配信しています。
- 科学ラジオ …科学トピックをほぼ毎日配信中!AI技術を駆使して作成した「耳で楽しむ科学」をお届けします。
- 講演 …全国各地で実験講習会・サイエンスショー等を行っています。
- About …「科学のネタ帳」のコンセプトや、運営者である桑子研のプロフィール・想いをまとめています。
- お問い合わせ …実験教室のご依頼、執筆・講演の相談、科学監修等はこちらのフォームからお寄せください。