We Crashed a Dynamics Cart into a Target! What the Graphs Reveal About the Secret of “Speed Squared” (A Kinetic Energy Experiment)
“If your speed doubles, how much harder is the crash?”
When car accidents make the news, “excessive speed” is often blamed. That’s because even a small increase in speed makes the impact far worse than you’d expect. The secret behind it is something familiar from physics class: kinetic energy.
So what does kinetic energy depend on? When I asked my students for their hypotheses, the words “mass” and “velocity” came up.
This experiment is usually done on a small scale, rolling a marble down a rail into a target. My twist this time was to crash a 1 kg dynamics cart into a target box and work out the answer from how far the box gets pushed. Going bigger makes the results much easier to interpret. Here’s how it works.
What You’ll Need
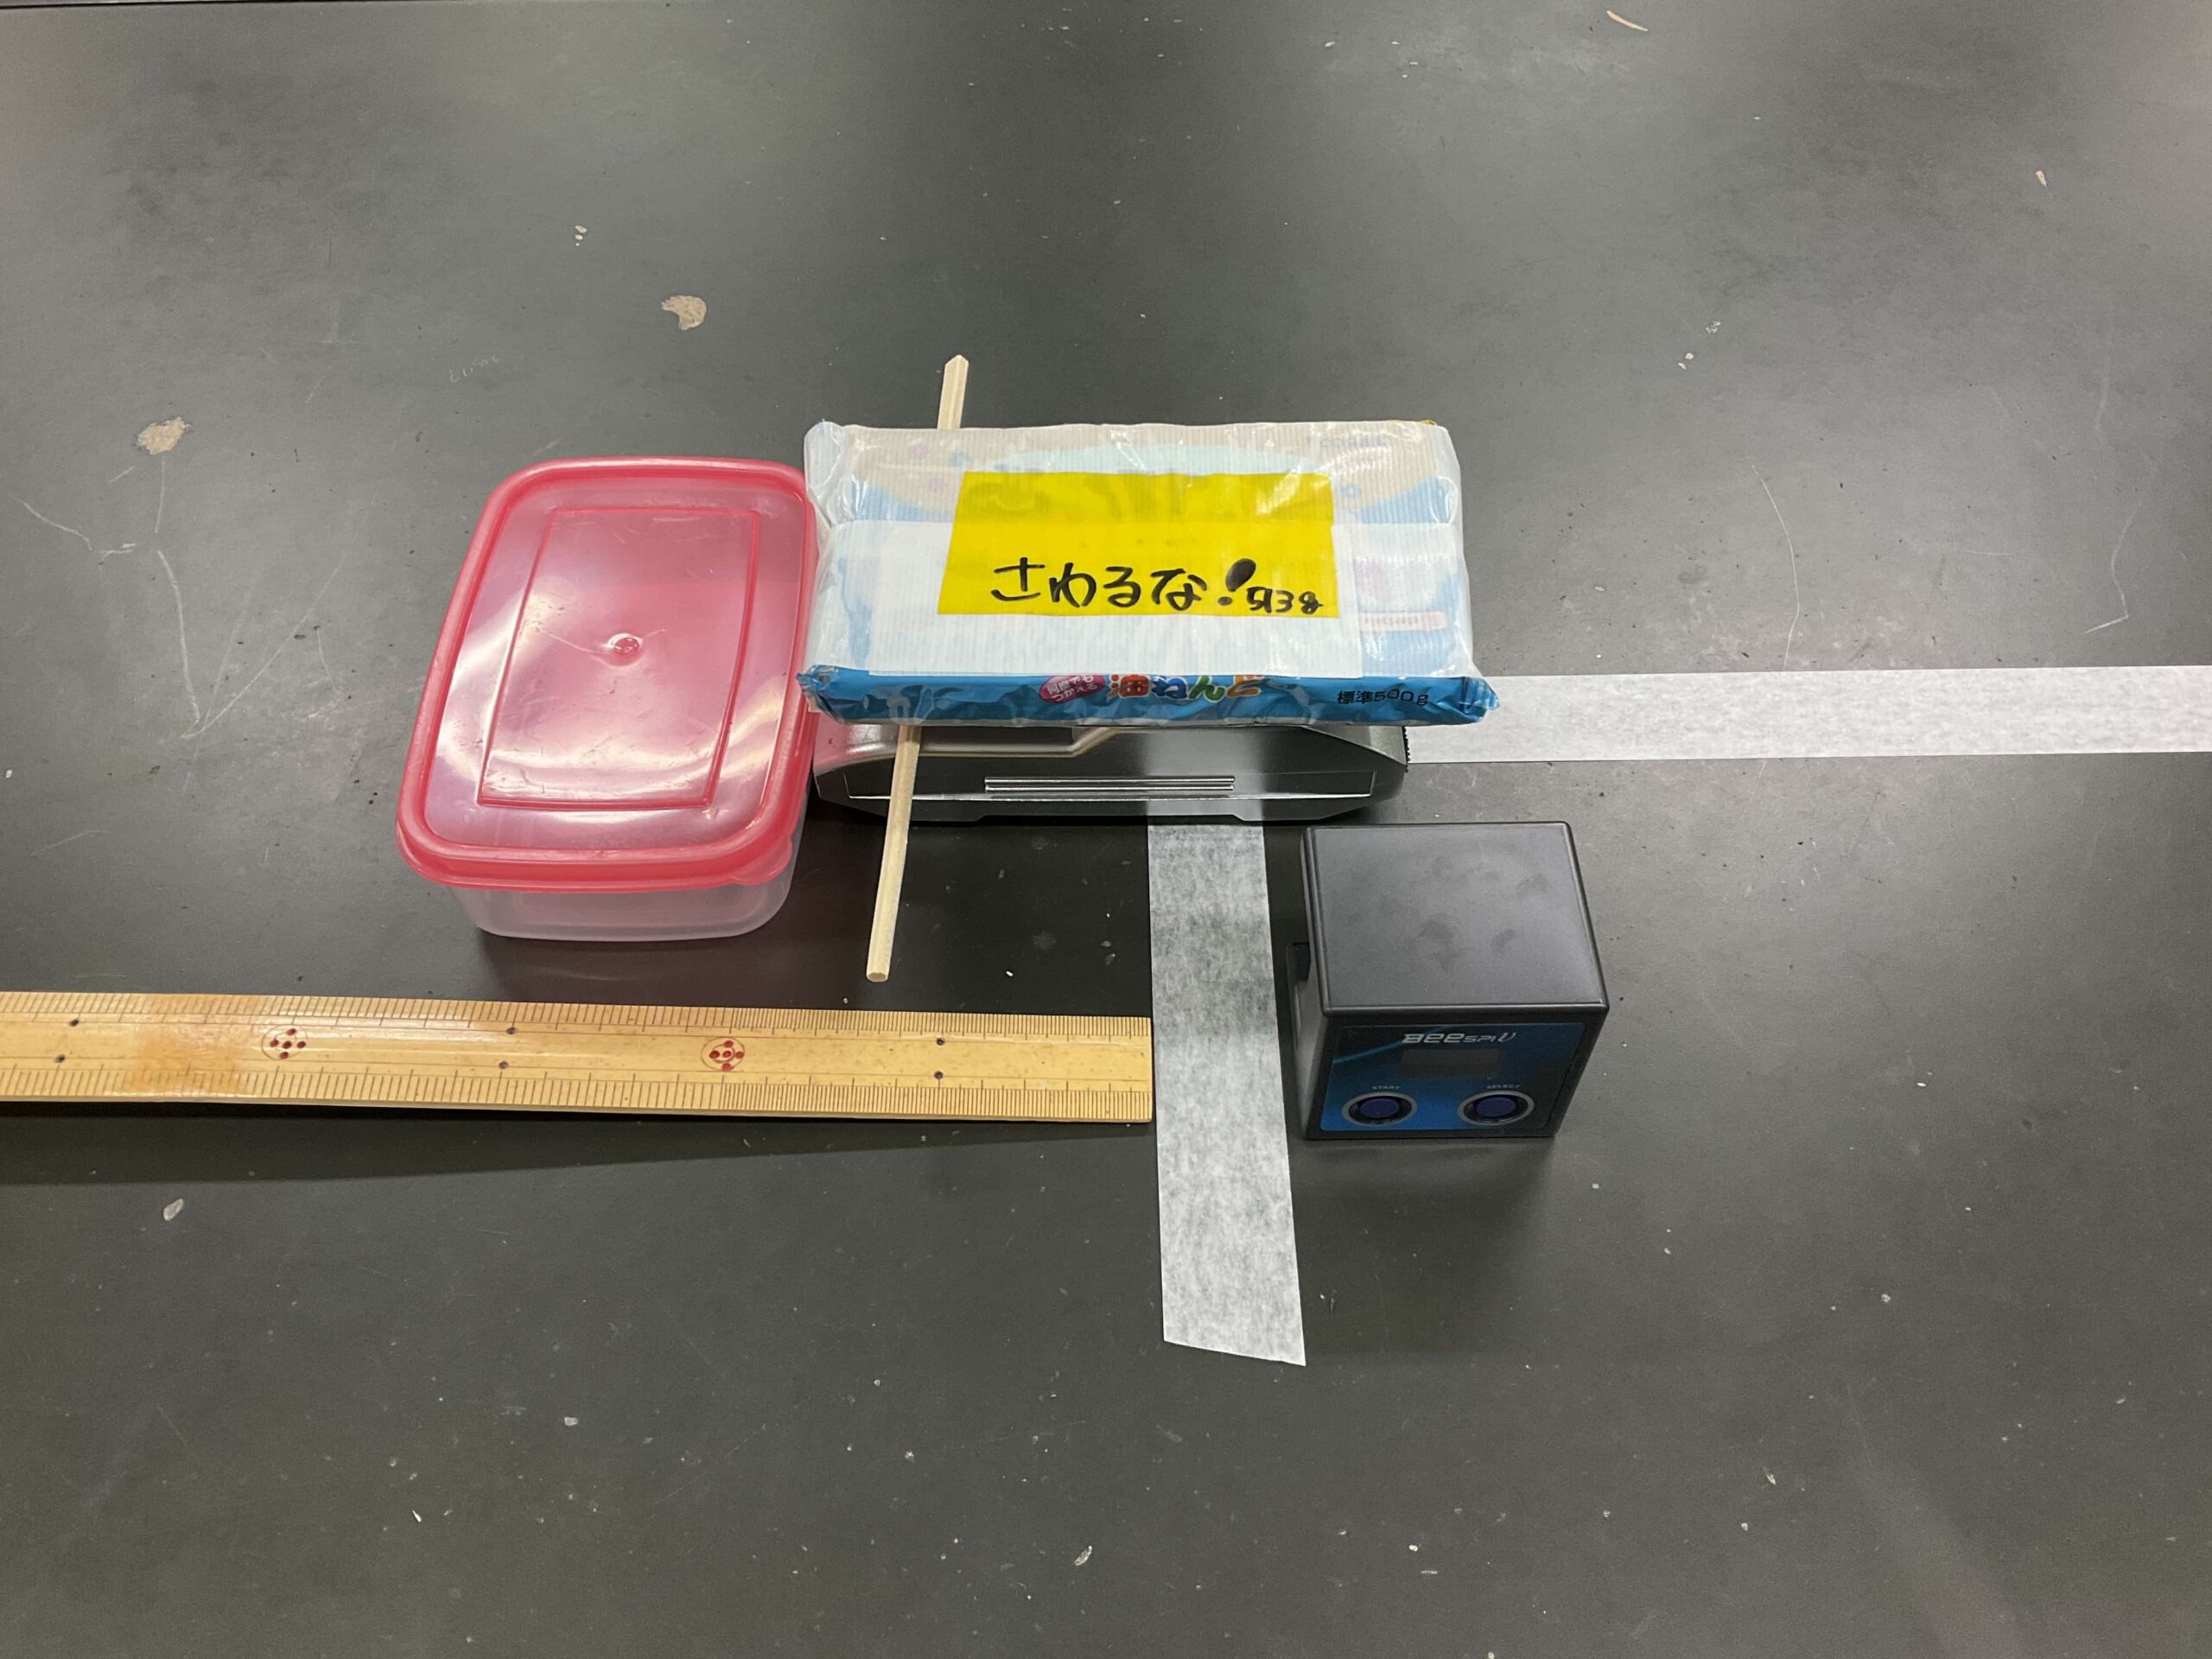
- Dynamics cart… It has a mass of 1 kg.
- Weights (500 g) x 2… I used two 500 g blocks of oil-based clay as a substitute. Put one on the cart and it becomes 1.5 kg, put on two and it’s 2 kg, so you can easily change the cart’s mass.
- Beespi… A simple speedometer.
- Bamboo ruler
- Disposable chopsticks
- Ticker timer
- Masking tape… Used to mark spots on the desk.
- Target (box)… I made mine by stuffing some oil-based clay into a bento lunch container. It’s nice that you can build it from everyday items.
How to Do It
1. Tape a chopstick to the dynamics cart with masking tape. Then set up the target and run the cart through the Beespi to measure its speed right before it hits the target.
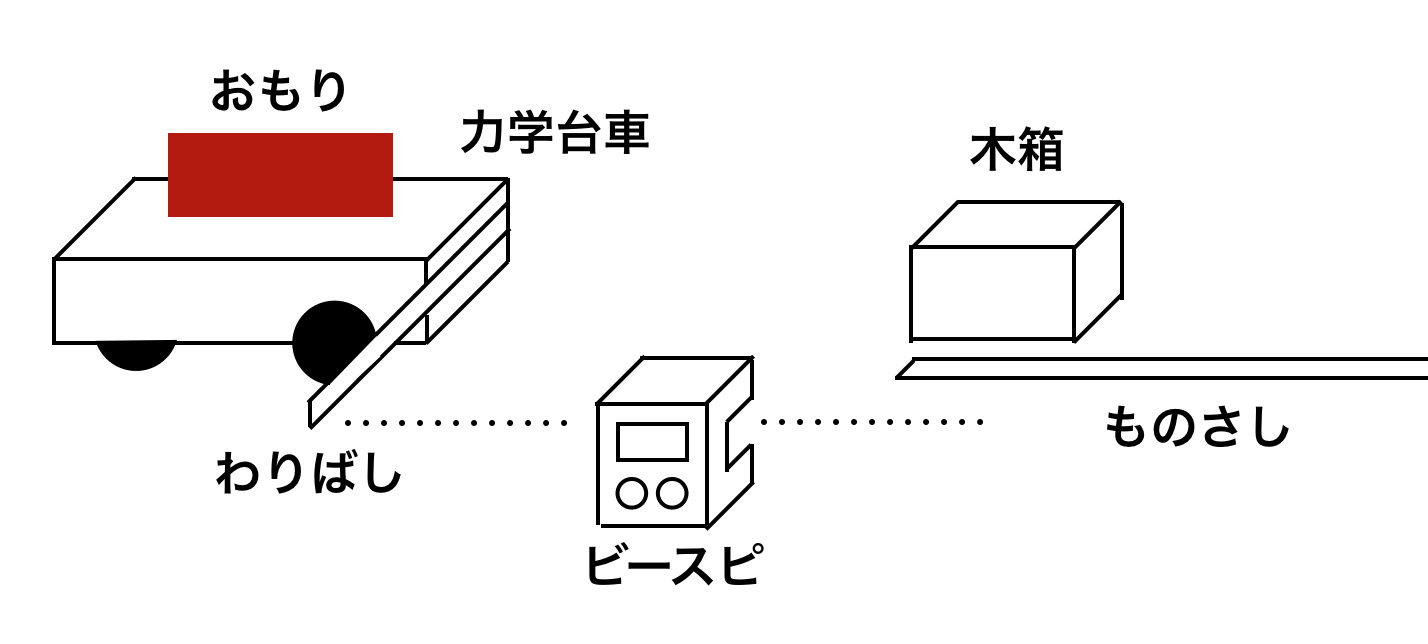
2. Vary the speed (between 0.20 and 0.80 m/s), crash the cart into the target, and record how far the target gets dragged.
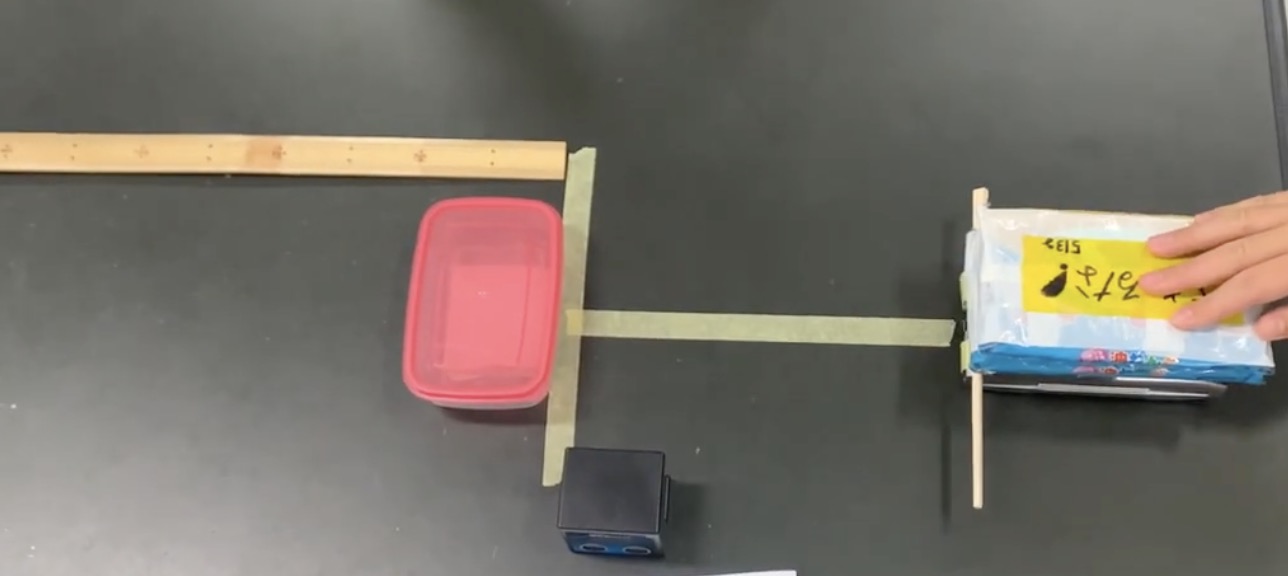
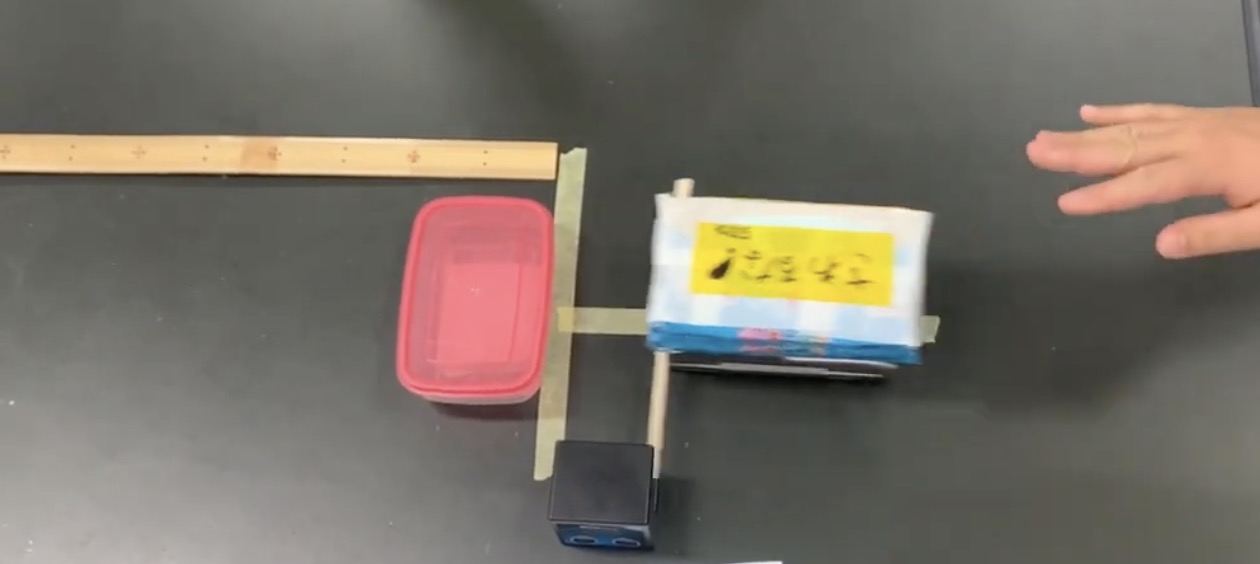
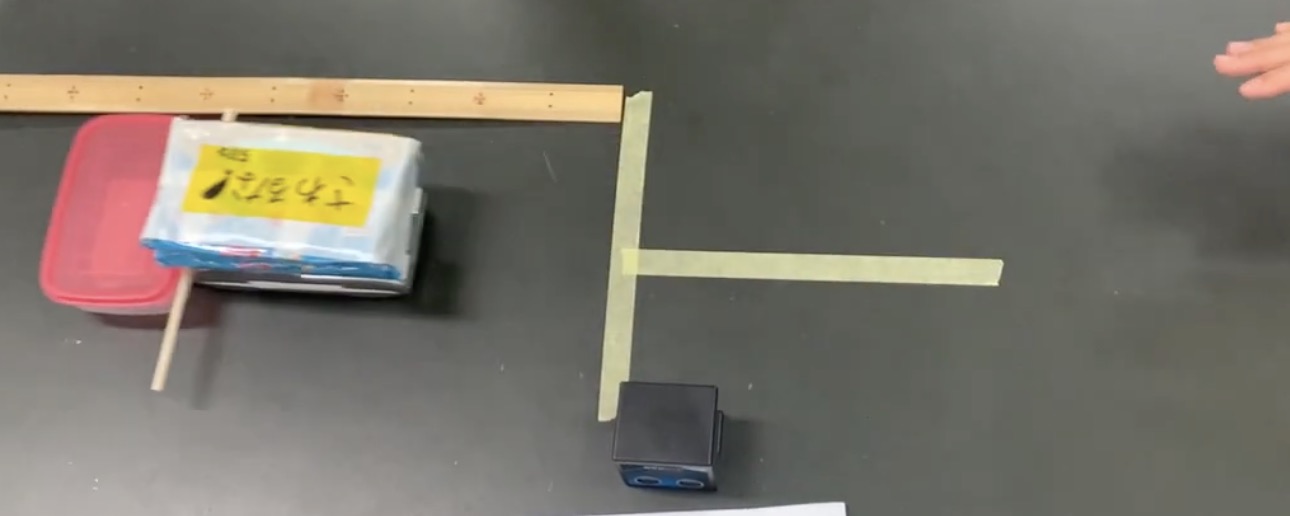
3. Once you have four data points, add one weight to make the cart 1.5 kg and repeat. When you’re done, add the second weight to make it 2.0 kg and run the experiment again.
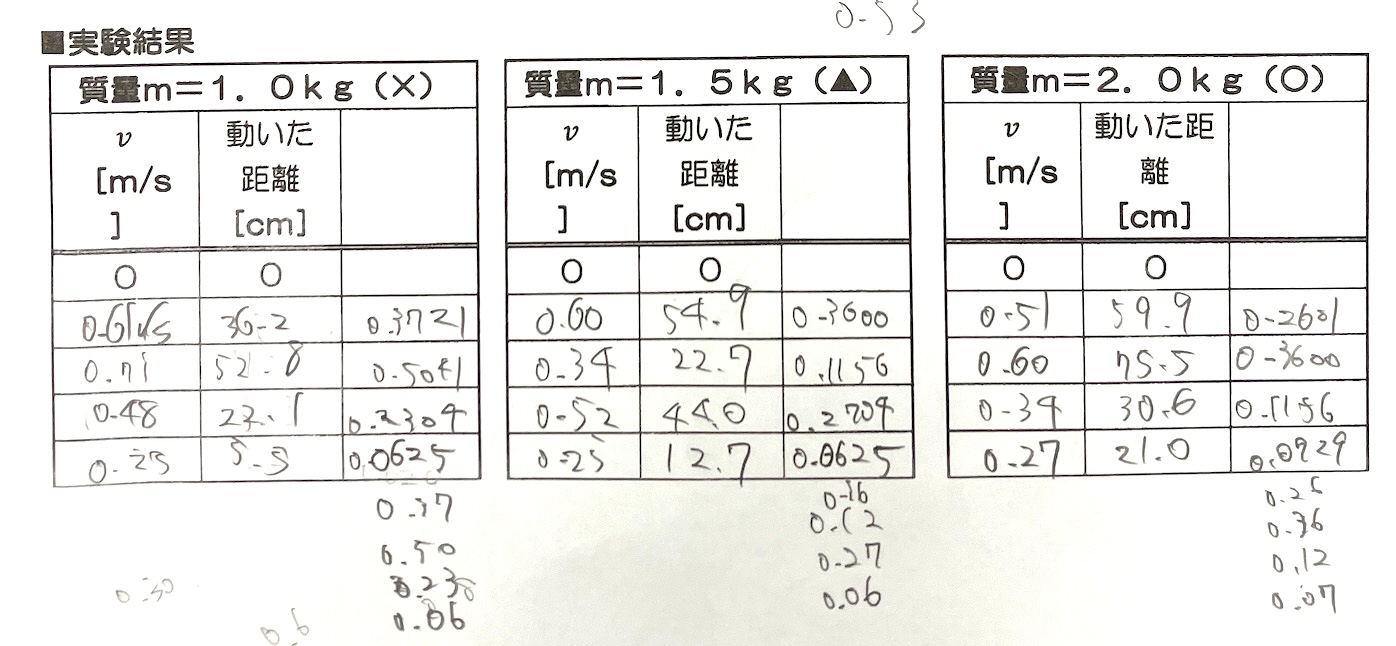
Result 1: Speed vs. Distance Moved
Now it’s time to analyze the results and turn them into graphs. This is where students start to wonder and debate which kind of function fits the data, and it’s honestly the most fun part of the whole experiment.
Let’s start with speed and distance. Put the distance the box moved on the vertical axis and the speed on the horizontal axis.
Most of my students guessed a linear function. But when you actually plot the graphs for 1.0 kg, 1.5 kg, and 2.0 kg, they don’t come out as straight lines. Instead, you get a graph that curves upward.
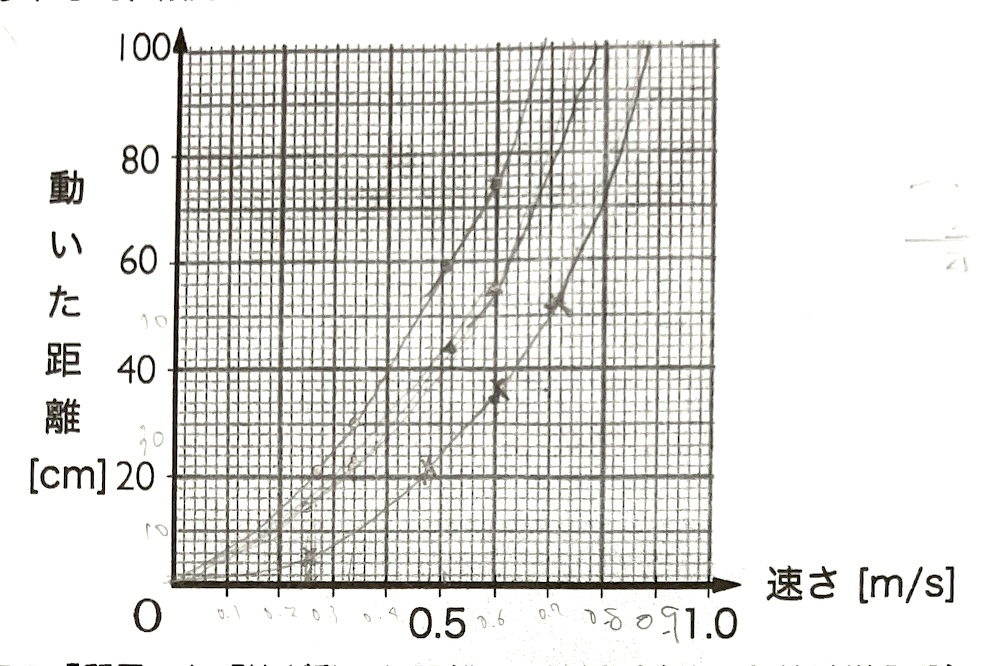
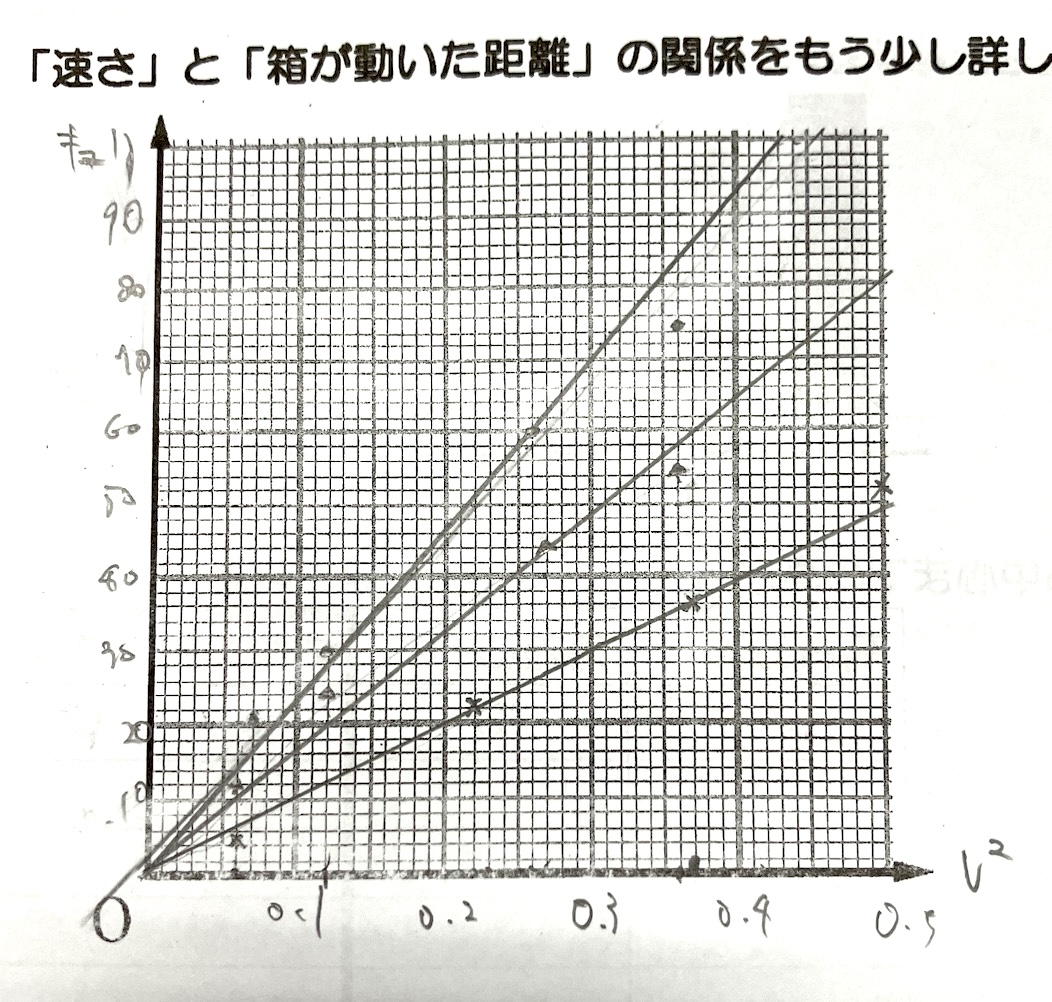
A curve like this might be a quadratic function, so let’s dig deeper. To test that idea, we square the speed on the horizontal axis. Plot the distance moved against the square of the speed, and you’ll find that the distance is proportional to the square of the speed.
Result 2: Mass vs. Distance Moved
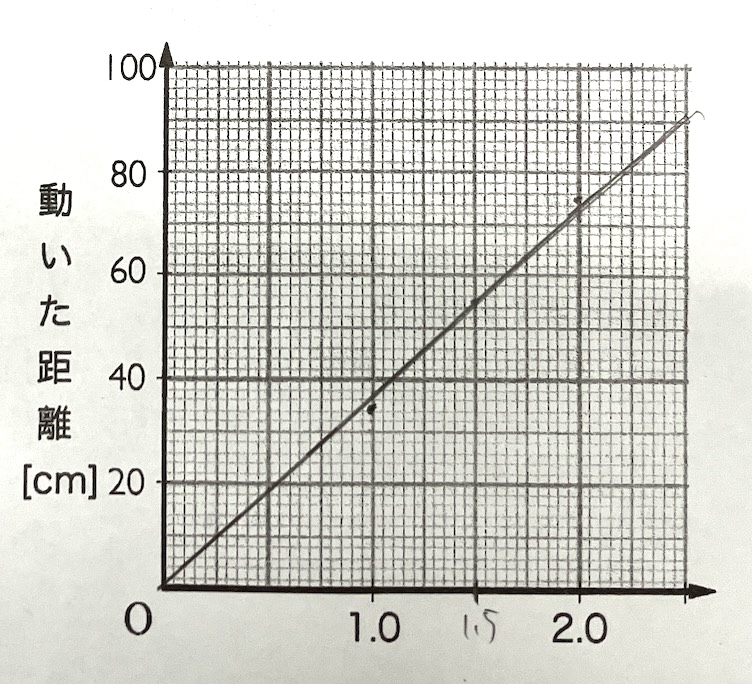
Next up is mass. To compare masses fairly, you need to compare them at the same speed. But getting the 1.0 kg, 1.5 kg, and 2.0 kg carts to hit the Beespi at exactly the same speed is next to impossible. So we use the graphs we just made and read off the distance the target moved at the same speed.
When you graph that (distance moved on the vertical axis, mass on the horizontal axis), you get a straight line.
The Big Reveal: What Kinetic Energy Really Is
Putting it all together, we can conclude that kinetic energy is proportional to the square of the speed and proportional to the mass. Written as a formula, it starts to look like the famous “1/2 × m × v²”.
There’s a catch, though: this experiment can’t tell us anything about that 1/2. Some students tried to squeeze it out of the slope of the graph, but when the cart and the box stick together and move as one, mechanical energy isn’t conserved. That means the experiment simply can’t pin down the coefficient.
This is a valuable lesson in itself, too. Knowing what an experiment can tell you, and what it can’t, is a hugely important part of thinking scientifically.
These results connect directly to everyday life. Take a car’s brakes, for example.
If your speed doubles, your kinetic energy quadruples. That means the distance it takes to stop after hitting the brakes also becomes roughly four times longer. Stopping from 30 km/h and stopping from 60 km/h are very different stories. The “proportional to the square of the speed” graph we drew in this experiment ties right into road safety.
How You Read the Graph Changes Your Conclusions
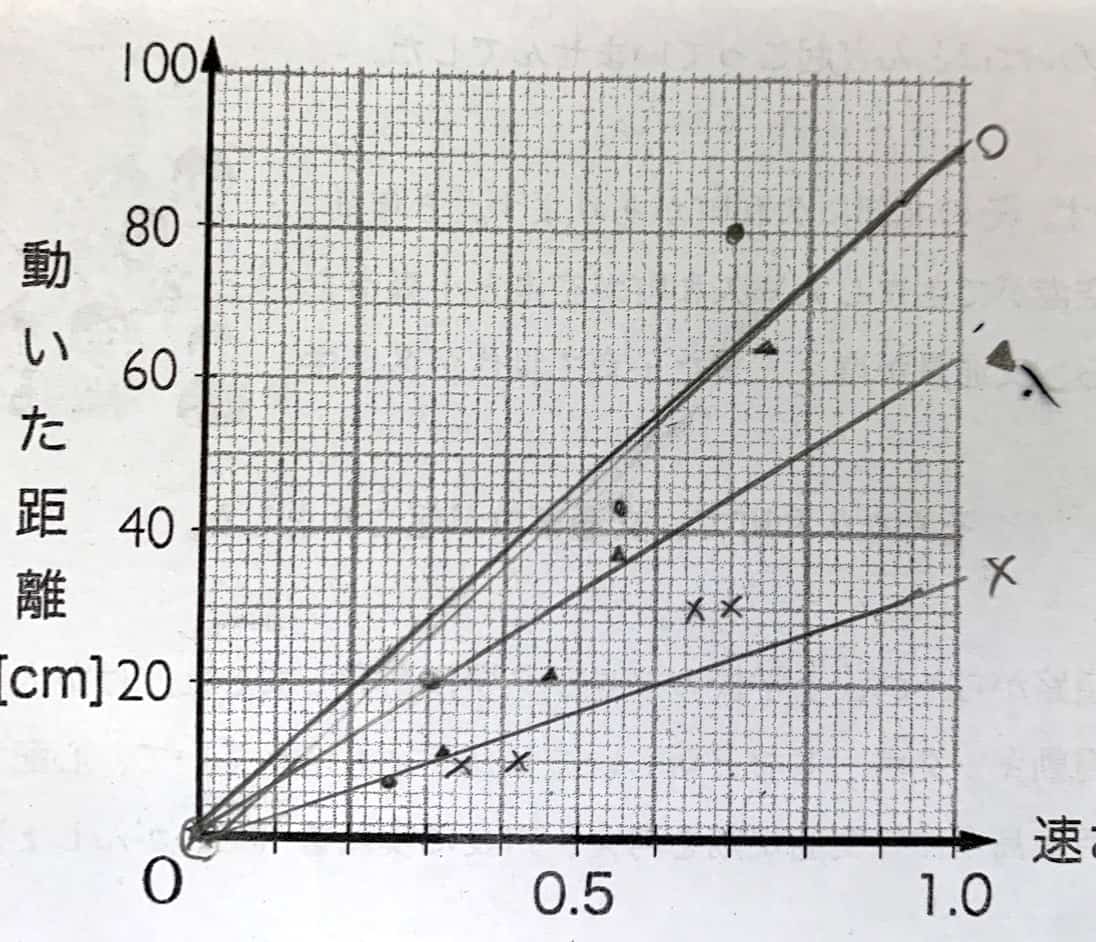
By the way, some students look at the graph with the target’s distance on the vertical axis and speed on the horizontal axis and decide it’s a linear function.
The same goes for mass, where some students wonder whether it might be a quadratic function.
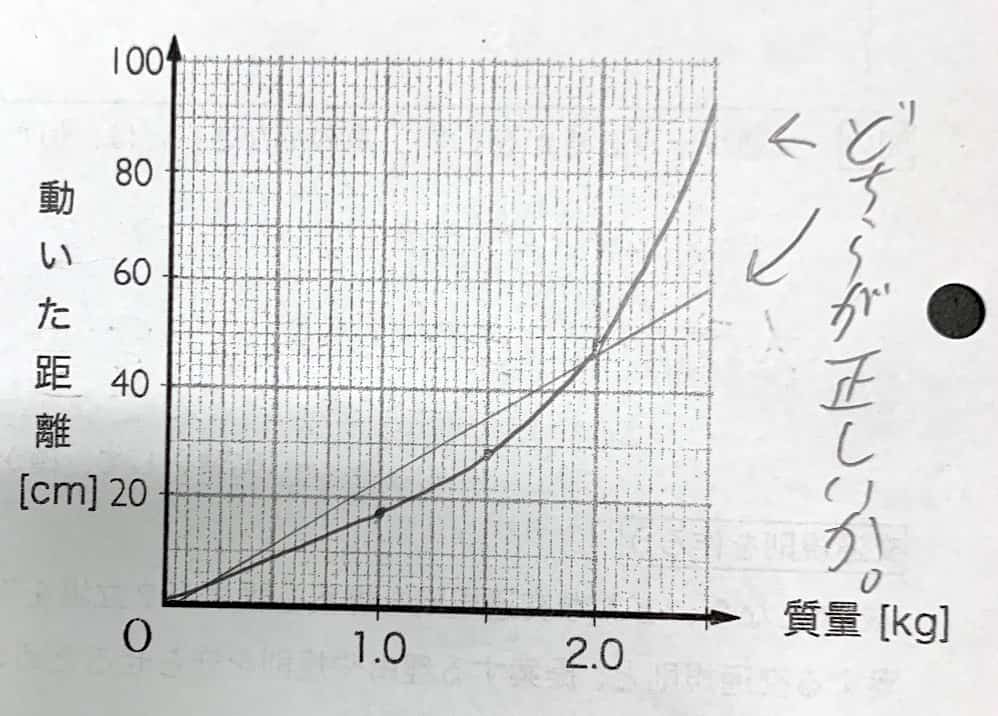
Depending on how you collect your data and what range you cover, a curved graph can sometimes look like a straight line. How you interpret that is a great example of how your analysis shapes your conclusions.
That said, because this experiment uses a cart and makes for a big, dynamic demonstration, careful work gives you remarkably clean graphs. You’ll be able to reach the conclusions you’re aiming for with confidence. Give it a try with everyday materials!
9月のイチオシ実験!
テレビ番組監修・イベント等のお知らせ
- 9月25日(金)21:00〜 かまいたちの瞬間回答!にて、科学監修を行いました。
- 10月10日(土)11:15~12:00 千葉市科学フェスタ2026「桑子先生の回転科学ショー」にてサイエンスショーを行います。

- 12月26日(土) ナリカサイエンスアカデミー(教員向け実験講習会)開催
書籍のお知らせ
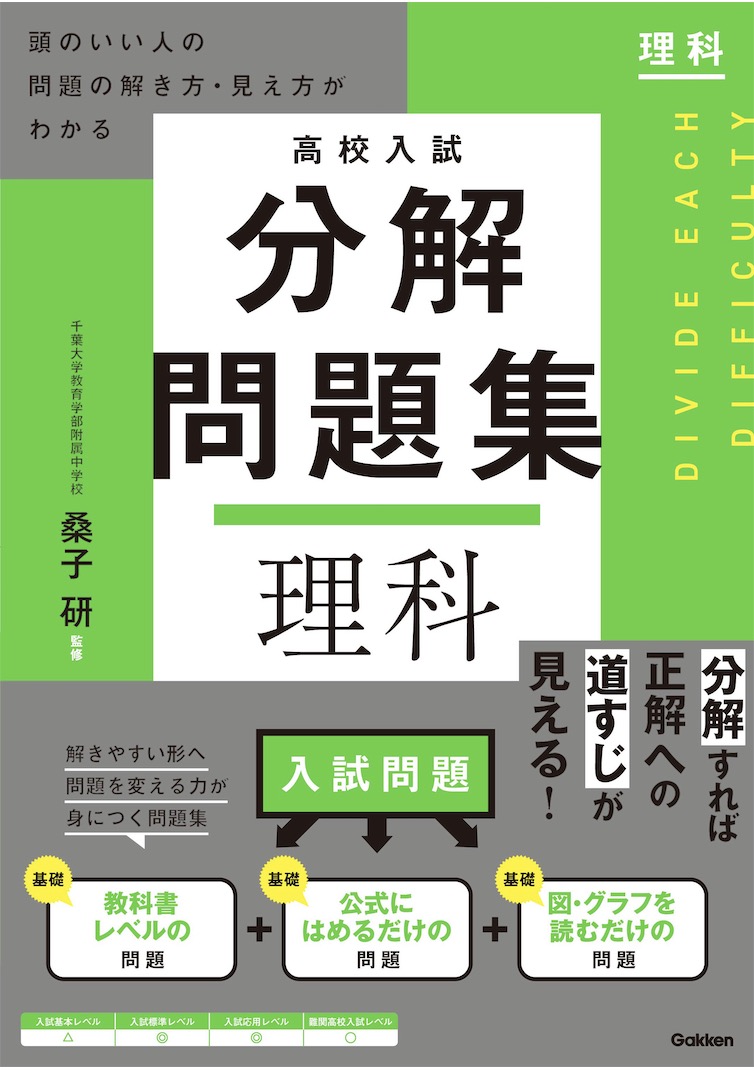
- 『高校入試 分解問題集 理科』(学研)…難しい問題も小さな問題に分解することで、問題を解くことができます。そんな分解の技術が身につくように深く関わりを持って作りました。
 『大人のための高校物理復習帳』(講談社)…一般向けに日常の物理について公式を元に紐解きました。特設サイトでは実験を多数紹介しています。※増刷がかかり6刷となりました(2026/02/01)
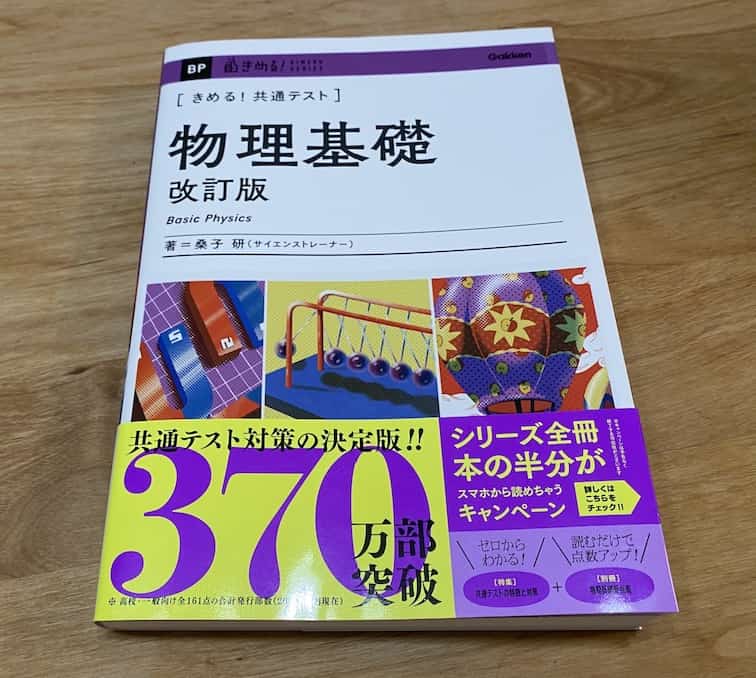
- 『きめる!共通テスト 物理基礎 改訂版』(学研)… 高校物理の参考書です。イラストを多くしてイメージが持てるように描きました。授業についていけない、物理が苦手、そんな生徒におすすめです。特設サイトはこちら。
各種SNS(更新情報をお届け!)
【日本語】X(Twitter)/instagram/Facebook 【英語】BlueSky/Threads
Explore
- 楽しい実験…お子さんと一緒に夢中になれるイチオシの科学実験を多数紹介しています。また、高校物理の理解を深めるための動画教材も用意しました。
- 理科の教材… 理科教師をバックアップ!授業の質を高め、準備を効率化するための選りすぐりの教材を紹介しています。
- Youtube…科学実験等の動画を配信しています。
- 科学ラジオ …科学トピックをほぼ毎日配信中!AI技術を駆使して作成した「耳で楽しむ科学」をお届けします。
- 講演 …全国各地で実験講習会・サイエンスショー等を行っています。
- About …「科学のネタ帳」のコンセプトや、運営者である桑子研のプロフィール・想いをまとめています。
- お問い合わせ …実験教室のご依頼、執筆・講演の相談、科学監修等はこちらのフォームからお寄せください。