Make Invisible Electricity Visible! Exploring Capacitor Discharge with Hand Calculations and Modern Sensors
I’m Ken Kuwako, your Science Trainer. Every day is an experiment.
Our lives are powered by smartphones and home appliances, and inside almost every one of them is a tiny component called a “capacitor.” Its job is simple yet vital: storing and releasing electricity. But since we can’t see electricity with the naked eye, it’s hard to imagine how it’s stored or exactly how much is packed inside.
To uncover the mystery of these “electrical reservoirs,” I recently conducted a hands-on capacitor charging and discharging experiment that’s perfect for middle schoolers and science enthusiasts alike. It’s a moment of pure “Aha!” when the abstract world of calculus—specifically integration—perfectly aligns with a real-world physical phenomenon.
Preparing the Experiment: Filling the Electrical Bucket
The goal of this experiment is to manually calculate the total amount of electricity stored in a capacitor through “integration” (basically, stacking up small pieces of data) and determine its “capacitance (C).”
First, we use a power supply to fully charge the capacitor at 5V (volts). Think of a capacitor like a cup or a bucket; it has a set limit on how much it can hold. To make sure we could observe the discharge process slowly and clearly, we added a 51Ω (ohm) resistor to the circuit.
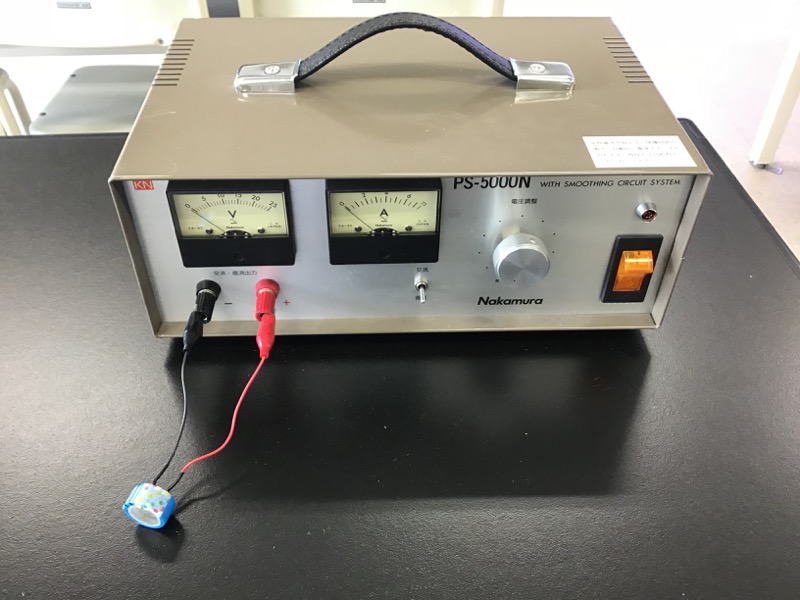
Charging up with the power supply
The Magic of Digital: Freezing Time with an iPad
In the old days, we’d have to stare intensely at the swinging needle of an ammeter and scribble down notes at lightning speed. Today, we have a better way: the iPad’s video camera.
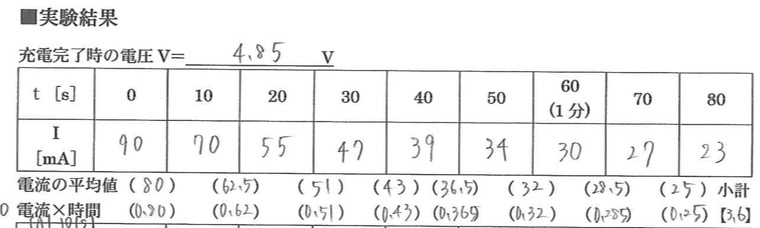
We record a five-minute video starting from the exact moment the discharge begins. By trimming the clip so the action starts at exactly “0 seconds,” we can collect incredibly precise data during playback.
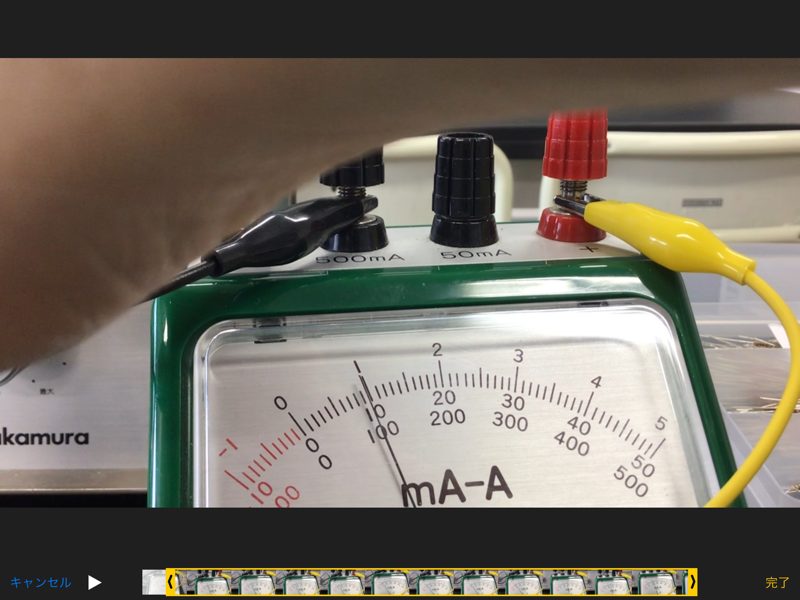
Editing the video afterward to align the start time.
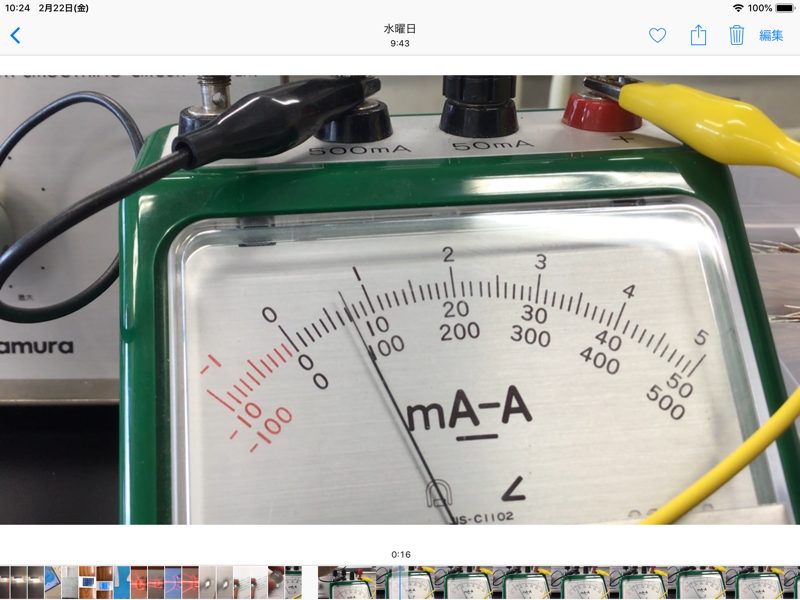
By pausing and scrubbing through the video, you can calmly record the current every 10 seconds.
With video, you can hit pause and record the current every 10 seconds without any stress. It really feels like having the magic power to stop time!
Is Integration Just Building Blocks? Mapping the Data
Once we have the numbers, the data analysis begins. This is where “integration” comes into play. While it might sound like a scary math formula, it’s essentially just the process of adding up all the tiny bits of flowing current over time.
When we plotted the five-minute data onto a graph, a beautiful “discharge curve” emerged, showing how the current gradually tapers off.
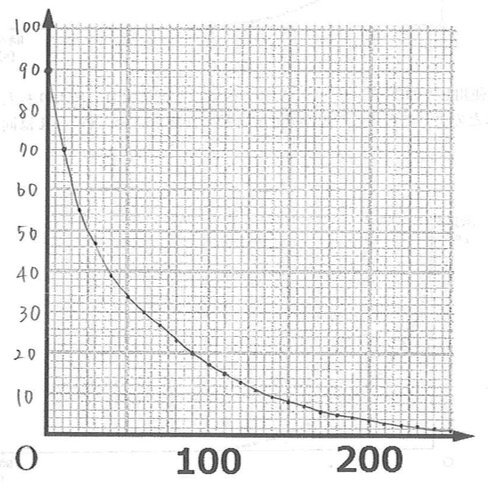
The students were genuinely excited. By crunching the numbers themselves, they had a realization: “The integration we learned in math class is actually finding the total amount of electricity flowing right now!”
A Surprising Result: The 1F (Farad) Threshold
When the calculations were finished, most groups arrived at a value very close to 1F (Farad). Now, 1 Farad is a massive amount of capacity! Most capacitors found in standard electronics are measured in “microfarads” (one-millionth of a Farad), so this experiment helped everyone realize just how much of a “giant bucket” we were dealing with.
Watching Electricity Fade via Sensors
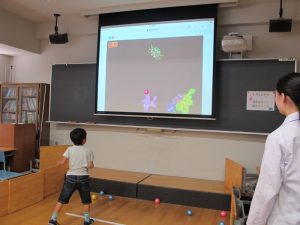
To wrap things up, I did a demonstration using a modern current sensor. The graph that students had worked so hard to calculate by hand was now being drawn on the screen in real-time.
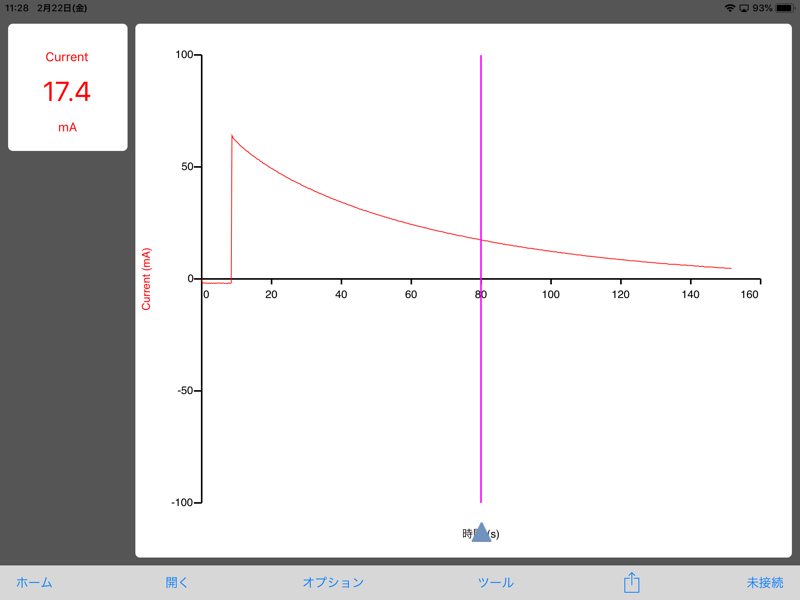
The best part is seeing the current drop in real-time. The students were cheering! Another great feature is the instant integration; you can select a range, and it automatically sums up the area under the curve.
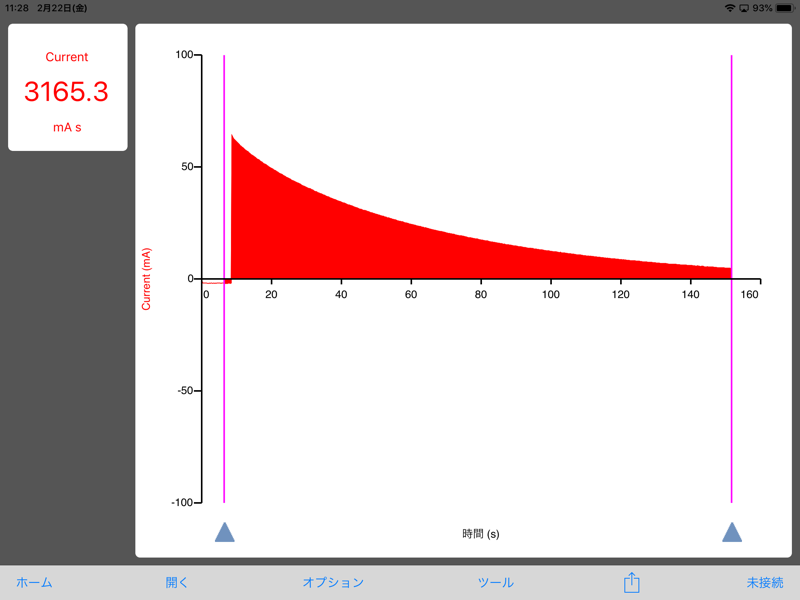
It’s fascinating to see exactly how much charge is left in the capacitor at a glance.
High-tech sensors can finish these calculations in a heartbeat, but doing it “by hand” first is what makes the sensor’s data truly meaningful. Visualizing invisible electricity as tangible numbers is the true thrill of science experiments!
Inquiries and Requests
I’m dedicated to making the wonders of science more accessible! I’ve put together plenty of fun experiments you can try at home along with helpful tips. Feel free to explore more!
My “Science Notebook” series is now a book! Details here.
Learn more about me (Ken Kuwako) here.
For work requests (writing, lectures, workshops, TV supervision, etc.), click here.
– Follow me on X (Twitter) for updates!
![]() Check out my experiment videos on the Science Material Channel!
Check out my experiment videos on the Science Material Channel!
NEW 分解問題集 理科
- 7月21日発売!『高校入試 分解問題集 理科』(学研)…難しい問題も小さな問題に分解することで、問題を解くことができます。そんな分解の技術が身につくように深く関わりを持って作りました。
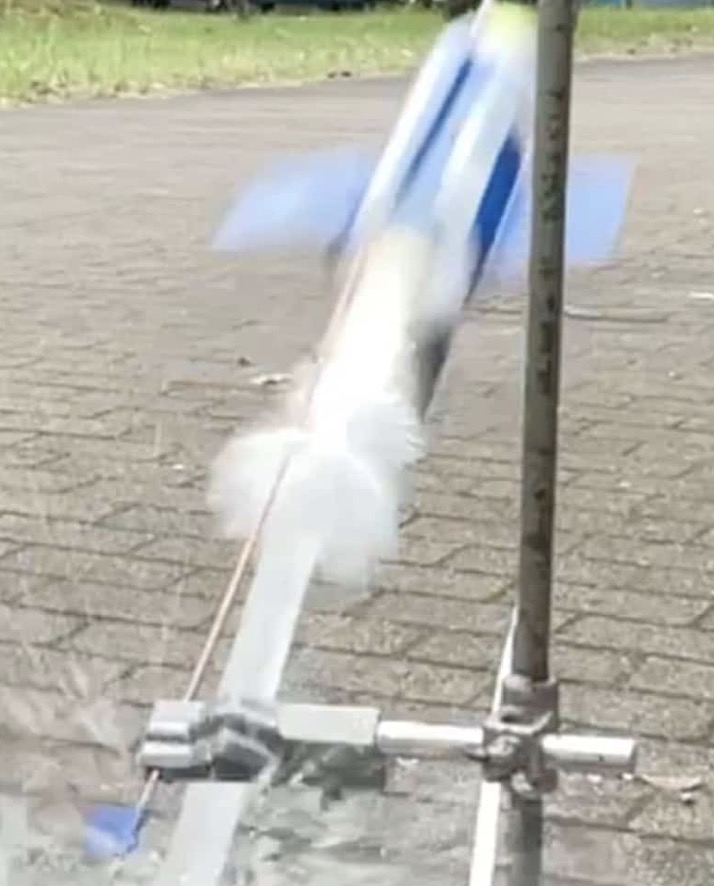
7月のイチオシ実験!
夏でプシュッと爽やか実験!
テレビ番組監修・イベント等のお知らせ
- 7月18日(土)「TIF presents ONE SONG FES. 」(フジテレビ)
- 7月18日(土) 教員向け実験講習会「ナリカカサイエンスアカデミー」
- 7月23日(木)科学監修 19:00〜 THE突破ファイル(日本テレビ)
- 7月30日(水) 監修したテレビ番組放送予定
- 12月26日(土) ナリカサイエンスアカデミー(教員向け実験講習会)開催
書籍のお知らせ
- 『大人のための高校物理復習帳』(講談社)…一般向けに日常の物理について公式を元に紐解きました。特設サイトでは実験を多数紹介しています。※増刷がかかり6刷となりました(2026/02/01)
- 『きめる!共通テスト 物理基礎 改訂版』(学研)… 高校物理の参考書です。イラストを多くしてイメージが持てるように描きました。授業についていけない、物理が苦手、そんな生徒におすすめです。特設サイトはこちら。
各種SNS(更新情報をお届け!)
【日本語】X(Twitter)/instagram/Facebook 【英語】BlueSky/Threads
Explore
- 楽しい実験…お子さんと一緒に夢中になれるイチオシの科学実験を多数紹介しています。また、高校物理の理解を深めるための動画教材も用意しました。
- 理科の教材… 理科教師をバックアップ!授業の質を高め、準備を効率化するための選りすぐりの教材を紹介しています。
- Youtube…科学実験等の動画を配信しています。
- 科学ラジオ …科学トピックをほぼ毎日配信中!AI技術を駆使して作成した「耳で楽しむ科学」をお届けします。
- 講演 …全国各地で実験講習会・サイエンスショー等を行っています。
- About …「科学のネタ帳」のコンセプトや、運営者である桑子研のプロフィール・想いをまとめています。
- お問い合わせ …実験教室のご依頼、執筆・講演の相談、科学監修等はこちらのフォームからお寄せください。