Trace the “Footprints” of an Earthquake! Discover Hidden Secrets with Isoseismal Maps on a Blank Chart
I’m Ken Kuwako, your Science Trainer. Every day is an experiment.
You may have heard the phrase, “An earthquake is a living entity.”
How does a phenomenon that occurs deep underground travel and manifest on the surface? We held a lesson designed to visualize the “footprints of an earthquake,” something you can’t grasp just by looking at a quick seismic intensity report on the news.
This time, I’d like to introduce a workshop we conducted in our Earth Science class where students worked with data to reveal the true shape of an earthquake. Watch how the students, despite initial struggles, gradually uncovered the fundamental laws of nature.
Mapping the Invisible “Shaking” on a Map
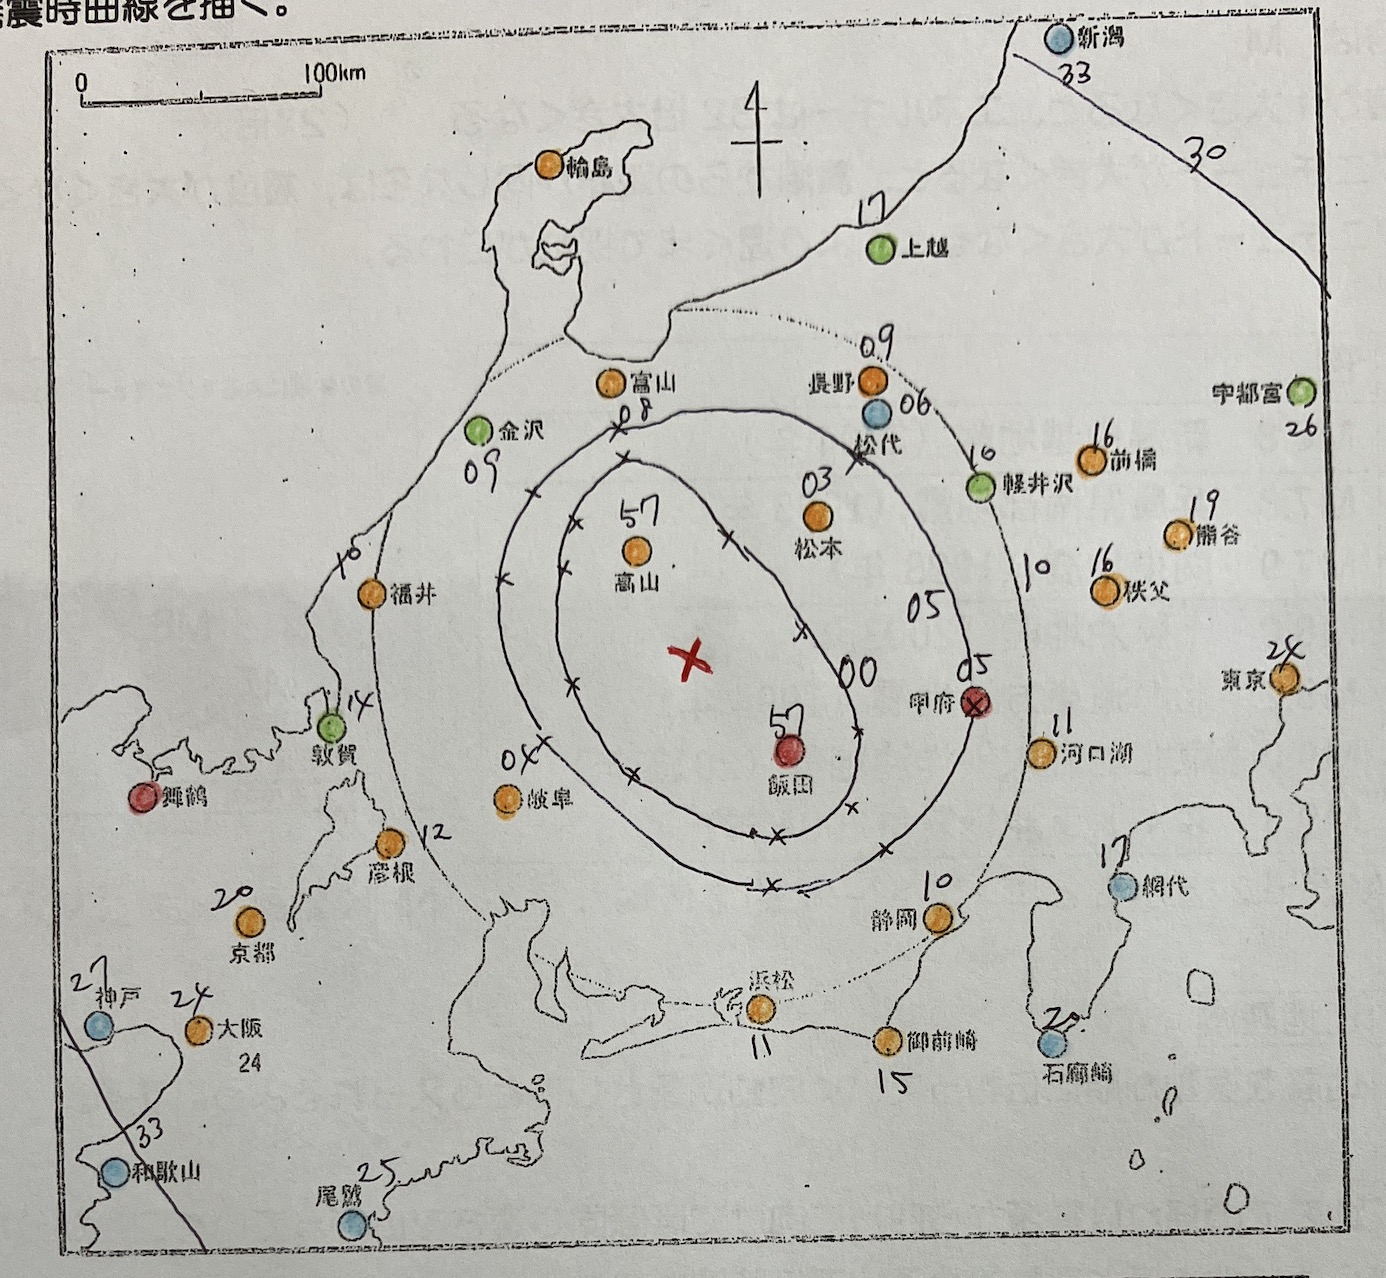
For this activity, we used real earthquake data and a blank map. The first mission was to fill in the circles next to each location name with the exact time the shaking began (seconds only) and color-code the seismic intensity.
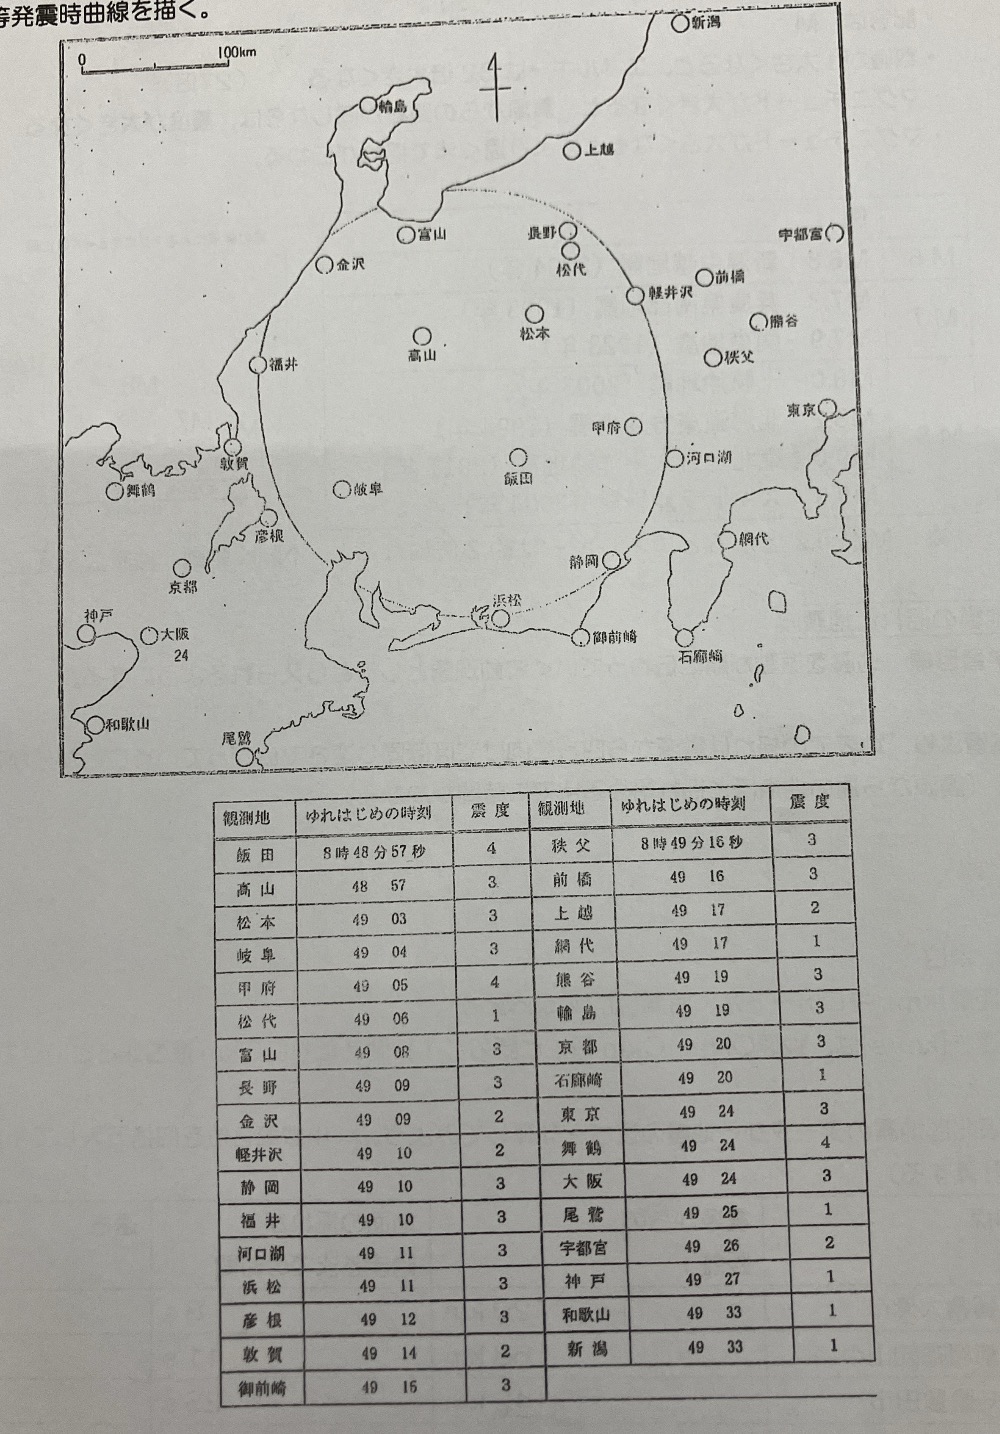
While it initially looks like a mere string of numbers, as students meticulously color-coded each point, a pattern slowly began to emerge.
Capturing the Ripples with “Isosiesmal Time Curves”
This is where the challenge—and the fun—begins. Students were tasked with drawing “Isosiesmal Time Curves”—lines connecting all the locations that began shaking at the exact same moment in time (e.g., 0 seconds, 5 seconds, 10 seconds, 30 seconds, etc.). Think of them as contour lines for pressure on a weather map.
The students struggled intensely with how to draw these lines.
For example, let’s say Iida in Nagano Prefecture shook at “57 seconds,” and Kofu in Yamanashi Prefecture shook at “05 seconds.” “Did time reverse?” one might think initially. But this simply means the time crossed over into the next minute. Therefore, the “00 second” mark must exist somewhere between the 57-second point and the 05-second point.
“It’s between 57 seconds and 05 seconds… so the 00-second mark should be right around here!”
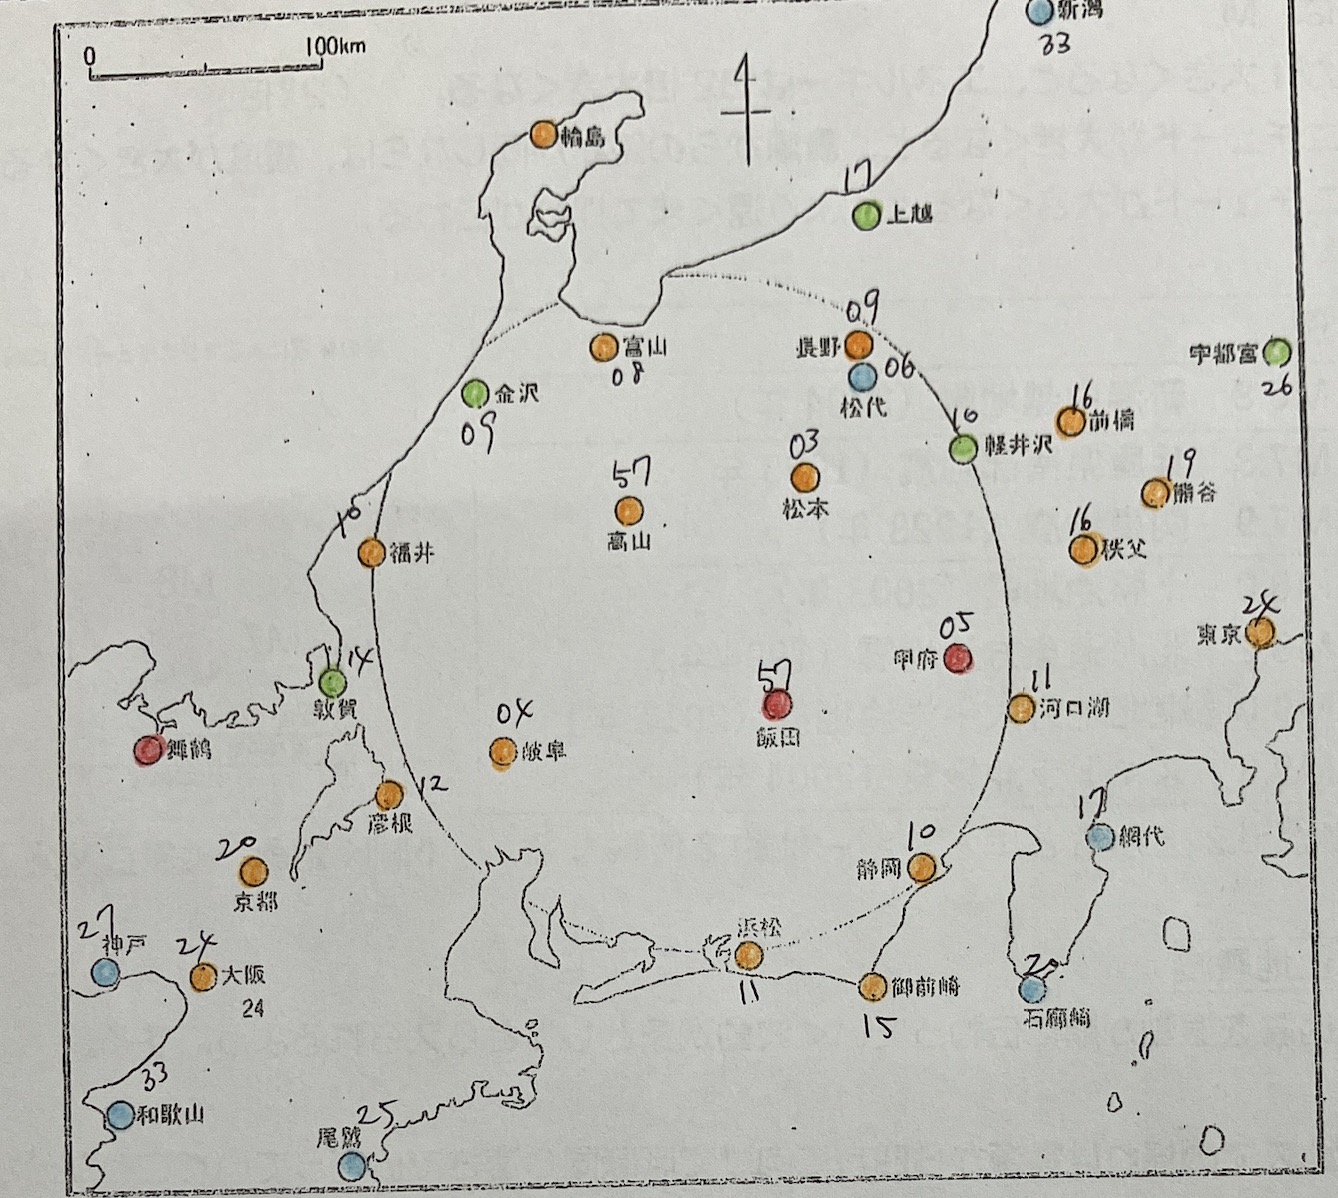
Students used this kind of deduction to mark the estimated passing points with an “X.” It was like a dot-to-dot puzzle, but by connecting these inferred points, beautiful, circular curves began to materialize on the map.
Unlocking the Earth’s Mystery from the Map
Finally, the students marked the epicenter (the center of the earthquake) with a red ‘X’. Looking at the completed map, the textbook knowledge they had learned suddenly appeared before them as live data.
The first realization is that the shaking “spreads out in circular ripples centered around the epicenter.” This confirms that if the properties of the rock underground are uniform, seismic waves propagate outwards at similar speeds in all directions—just like tossing a stone into a pond.
Next, they observe the fundamental attenuation property: “The closer to the epicenter, the higher the intensity; the farther away, the weaker the shaking.”
However, here is where an interesting discovery often occurs. Even though the shaking should generally weaken the farther it is from the source, occasionally a location, like Maizuru in Kyoto, might suddenly show a much higher intensity reading.
“Sensei, why is the color different only in this spot?”
This is the fascinating part of science. Why was the seismic intensity amplified in that one location?
The generally accepted answer lies in the difference in the “ground conditions (jiban).” Shaking is less severe on solid bedrock, but on soft ground (like near rivers or reclaimed land), the seismic waves can be amplified like jello (this is quantified as the site amplification factor).
Furthermore, students can speculate about other factors, such as the condition of the building where the seismometer is installed or the possibility of an unseen fault line moving.
Just one map contains so many secrets of the Earth—from the hardness of the ground to the nature of wave propagation. I encourage you to experience this scientific story firsthand by putting pencil to paper in your own classroom!
Inquiries and Requests
Make the wonders and fun of science more accessible! We provide easy-to-understand tips and fun science experiments you can do at home. Feel free to search around! ・The content of our Science Notes has been published in a book. Find out more here ・About the operator, Ken Kuwako: here ・For various requests (writing, lectures, science classes, TV supervision, appearances, etc.): here ・Article updates are distributed on X!
![]() Our Science Tricks Channel posts experiment videos!
Our Science Tricks Channel posts experiment videos!
NEW 分解問題集 理科
- 7月21日発売!『高校入試 分解問題集 理科』(学研)…難しい問題も小さな問題に分解することで、問題を解くことができます。そんな分解の技術が身につくように深く関わりを持って作りました。
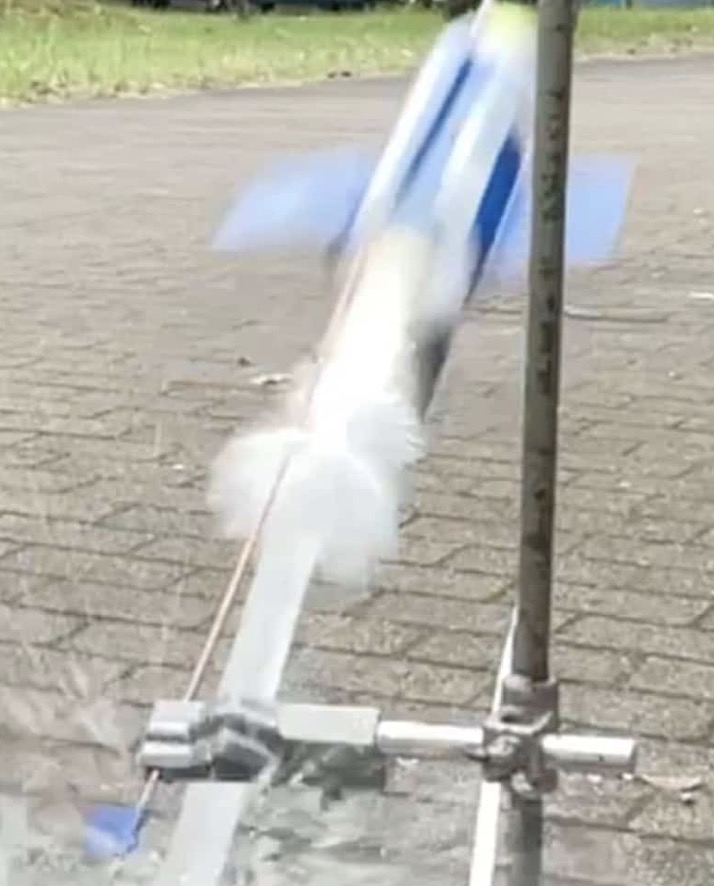
7月のイチオシ実験!
夏でプシュッと爽やか実験!
テレビ番組監修・イベント等のお知らせ
- 7月18日(土)「TIF presents ONE SONG FES. 」(フジテレビ)
- 7月18日(土) 教員向け実験講習会「ナリカカサイエンスアカデミー」
- 7月23日(木)科学監修 19:00〜 THE突破ファイル(日本テレビ)
- 7月30日(水) 監修したテレビ番組放送予定
- 12月26日(土) ナリカサイエンスアカデミー(教員向け実験講習会)開催
書籍のお知らせ
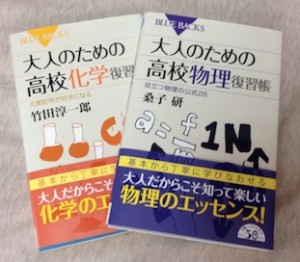
- 『大人のための高校物理復習帳』(講談社)…一般向けに日常の物理について公式を元に紐解きました。特設サイトでは実験を多数紹介しています。※増刷がかかり6刷となりました(2026/02/01)
- 『きめる!共通テスト 物理基礎 改訂版』(学研)… 高校物理の参考書です。イラストを多くしてイメージが持てるように描きました。授業についていけない、物理が苦手、そんな生徒におすすめです。特設サイトはこちら。
各種SNS(更新情報をお届け!)
【日本語】X(Twitter)/instagram/Facebook 【英語】BlueSky/Threads
Explore
- 楽しい実験…お子さんと一緒に夢中になれるイチオシの科学実験を多数紹介しています。また、高校物理の理解を深めるための動画教材も用意しました。
- 理科の教材… 理科教師をバックアップ!授業の質を高め、準備を効率化するための選りすぐりの教材を紹介しています。
- Youtube…科学実験等の動画を配信しています。
- 科学ラジオ …科学トピックをほぼ毎日配信中!AI技術を駆使して作成した「耳で楽しむ科学」をお届けします。
- 講演 …全国各地で実験講習会・サイエンスショー等を行っています。
- About …「科学のネタ帳」のコンセプトや、運営者である桑子研のプロフィール・想いをまとめています。
- お問い合わせ …実験教室のご依頼、執筆・講演の相談、科学監修等はこちらのフォームからお寄せください。